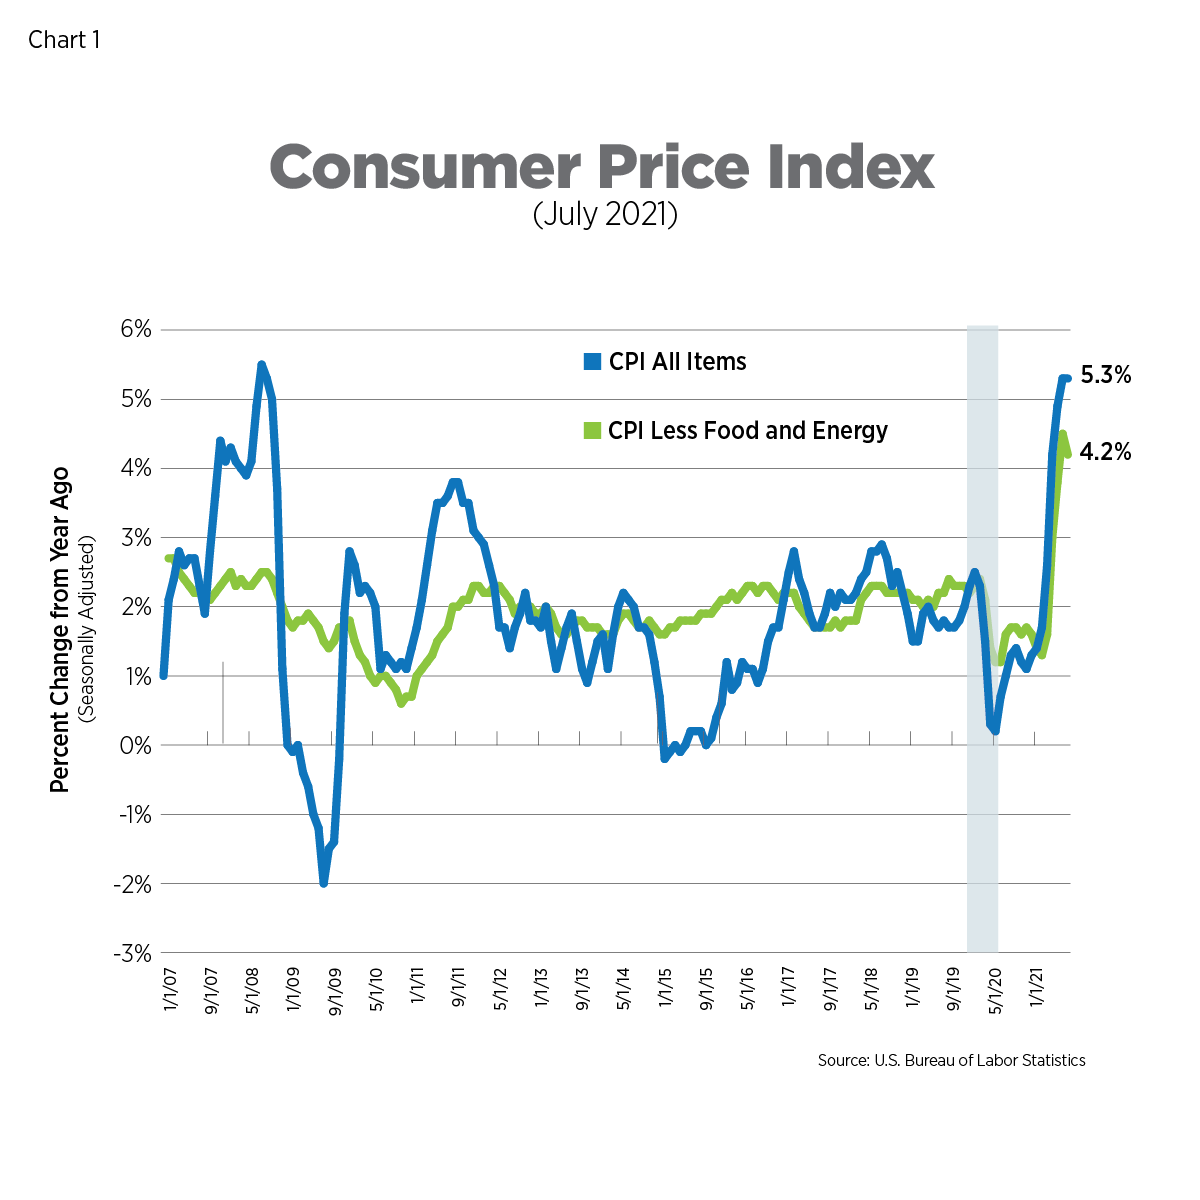
CPI, Latest Release, July 2021 5.3%
The Consumer Price Index (CPI) rose 5.3% on a year-over-year basis, the same rate as the prior month. Prices excluding food and energy (core CPI) moderated somewhat, rising 4.2%. Breaking down the data on a monthly basis reveals core CPI increasing at its slowest pace in 5 months.
This month’s price increases were driven by shelter, food, energy and new vehicles. The CPI for owners’ equivalent rent increased 0.3% on a monthly basis, on par with pre-pandemic levels, while the CPI for rent of primary residence remains below longer-term averages, rising 0.2% in July.
There are signs in the July data that prices closely tied to the reopening of the economy – used vehicles, apparel and airline fares, for example – are beginning to moderate. Prices for used cars and trucks rose 0.2% after average monthly increases of 9.3% during the second quarter while airline fares actually dropped. It is too soon to tell if this is the beginning of trend, but it is certainly on the right track to match the Fed’s expectations of temporary inflation.
Alternative Measures of Inflation, July 2021
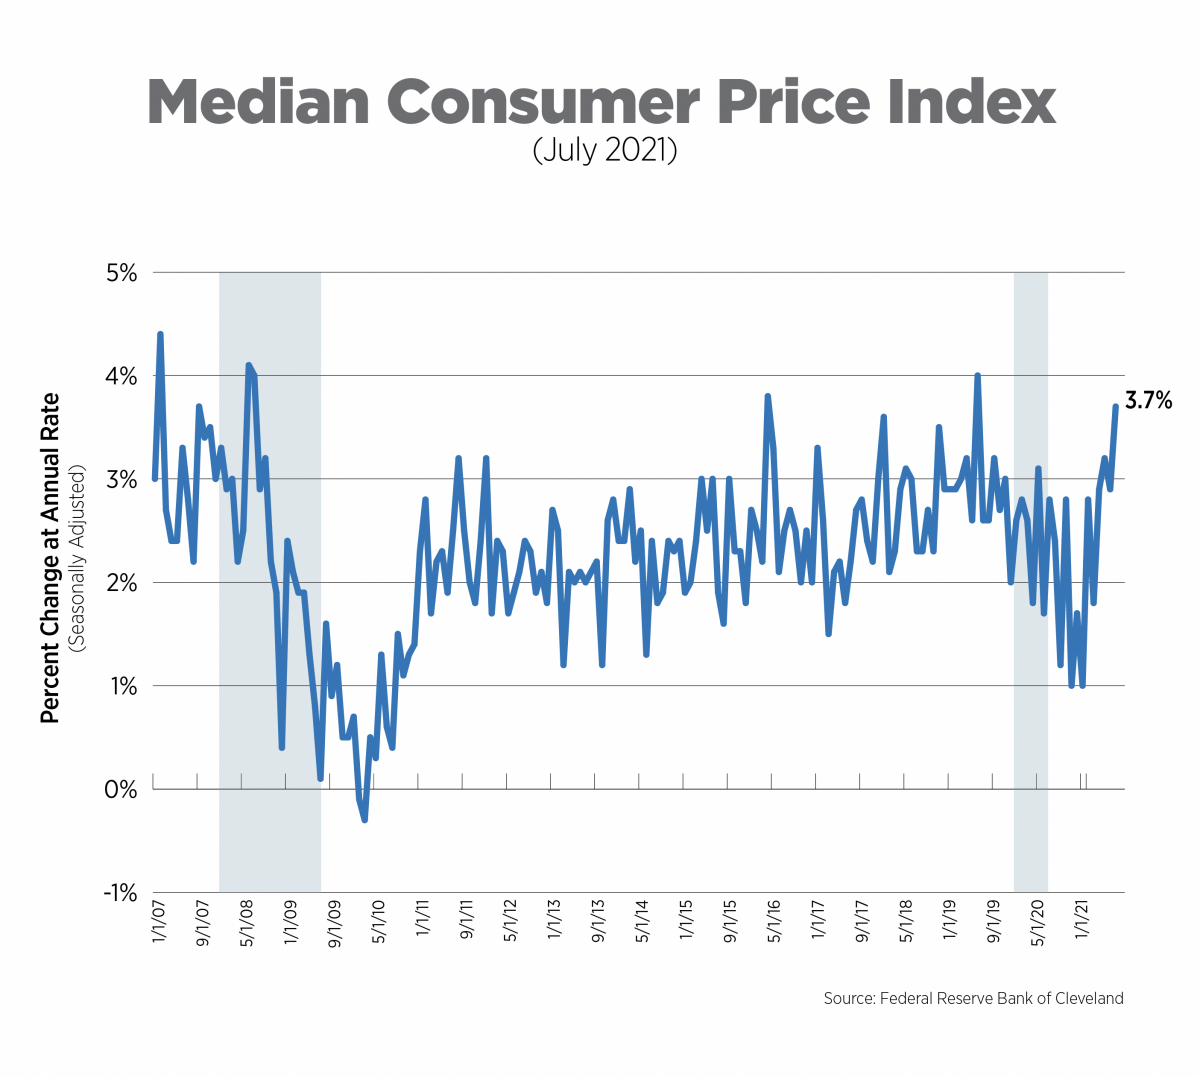
We looked at the Atlanta Fed’s sticky price index in the June and July Inflation Trackers. This month, we will focus on yet another alternative measure of inflation. The Federal Reserve Bank of Cleveland calculates the median CPI by omitting outliers (small and large price changes) and focusing on the interior of the distribution of price changes. Thus, it can provide a better measure of underlying inflation – that is, inflation that will likely persist over several years.
The median CPI rose 3.7% at an annualized rate and remains in line with levels hit before the pandemic. Components experiencing the greatest monthly increases were hotels, gasoline and personal care services. Significant declines were recorded for car and truck rentals, motor vehicle insurance and fresh fruits and vegetables.
Alternative Measures of Inflation, June 2021
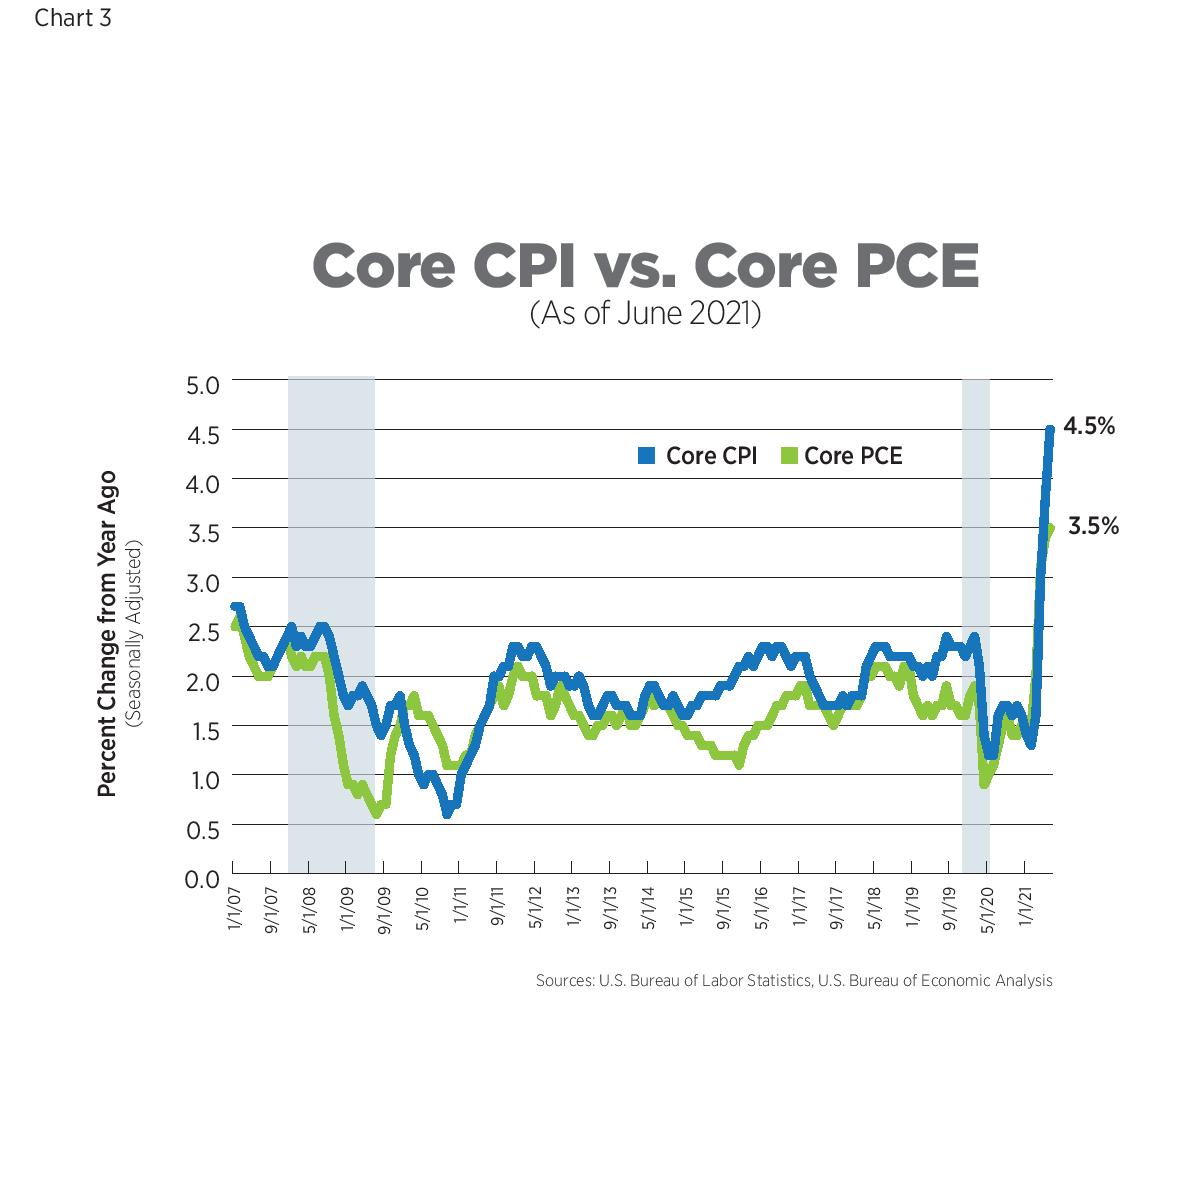
The Personal Consumption Expenditures (PCE) Index is the measure of inflation the Federal Reserve Bank uses in its policy decisions. It is produced by the Bureau of Economic Analysis and uses different formulas, different weights and has a different scope compared to the Bureau of Labor Statistics’ (BLS) CPI.
In June (the most recent data available) the core PCE increased 3.5% year-over-year, a 30-year high. May’s increase was revised downward and overall, the June reading came in somewhat lower than consensus forecasts. At its current rate of 3.5%, it would still take 6 more months for the PCE to achieve a five-year average of 2%, the Fed’s long-term target. The Federal Open Market Committee, the Fed’s policy arm, will not meet in August but stated in their July meeting that there would be no change to monetary policy at this point.
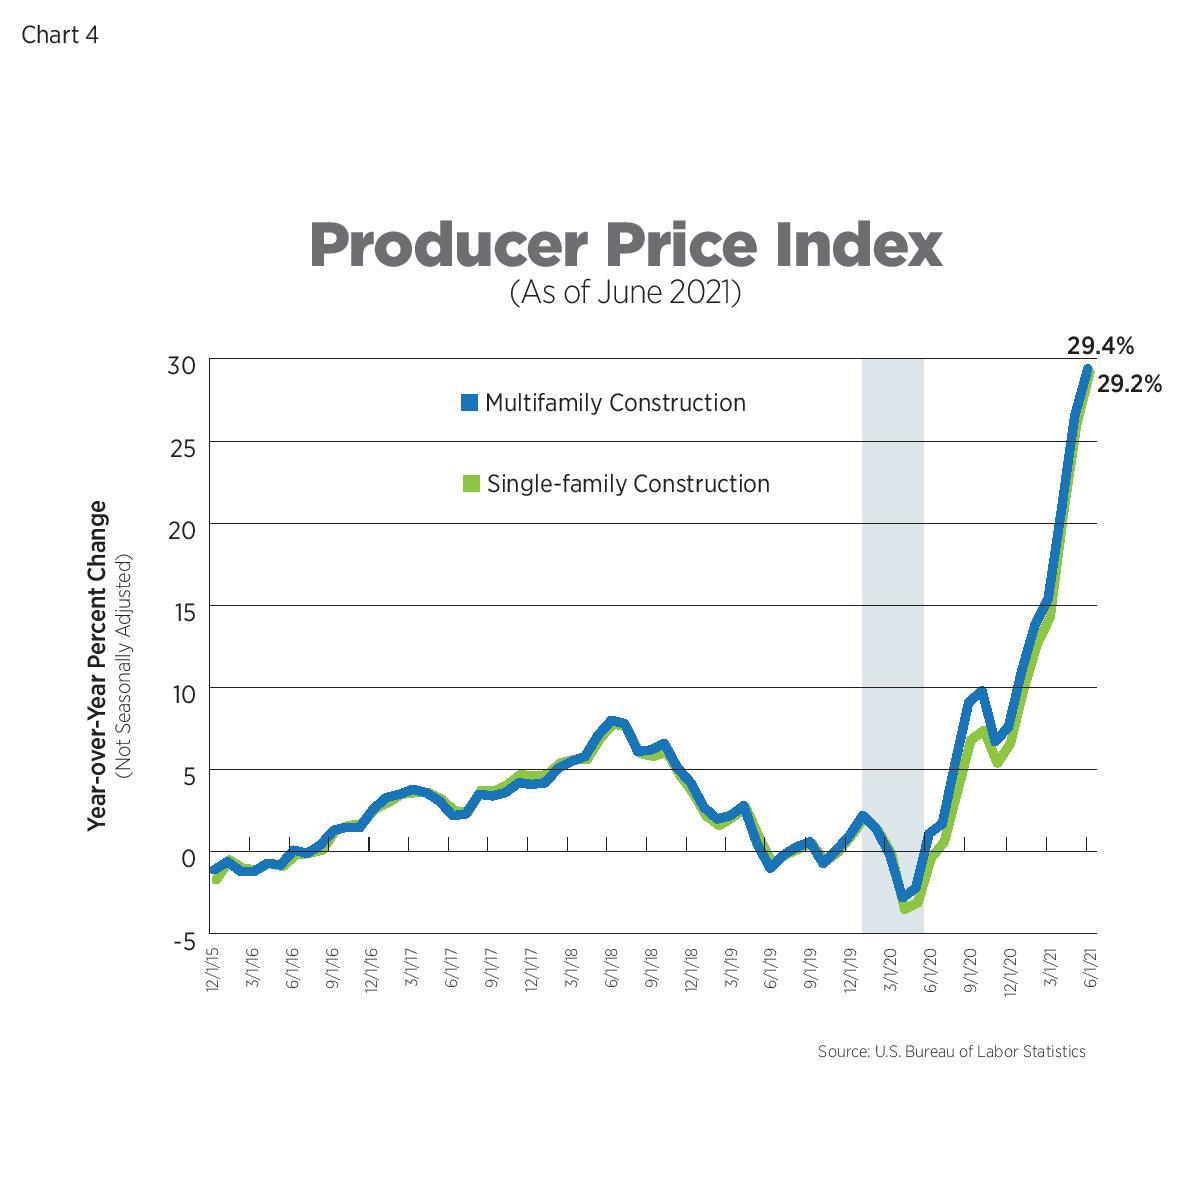
The Producer Price Index (PPI), June 2021
The BLS aggregates all construction inputs excluding capital investment, labor and imports for single-family and multifamily construction. Recent declines in lumber prices have not been enough to offset price increases of other building materials, resulting in construction cost increases that continue to break records. In June, the inputs to new construction rose nearly 30% year-over-year for both property types.
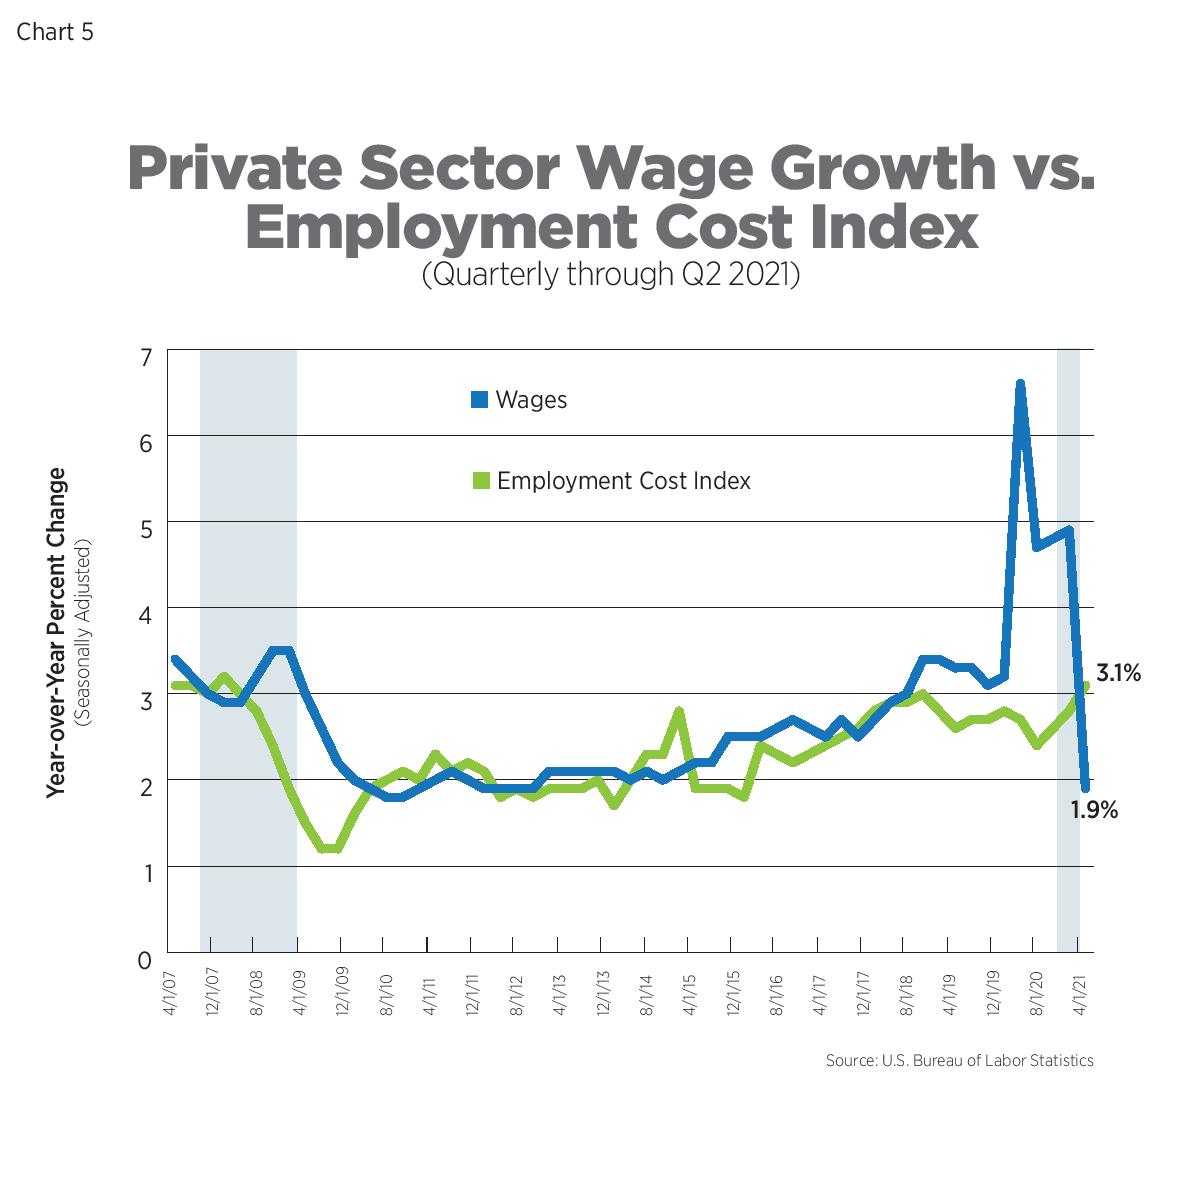
Wage Growth vs The Employment Cost Index, Q2 2021
The Employment Cost Index (ECI) is a quarterly measure of the change in the costs of labor. Unlike average hourly earnings, the series typically used for wage growth, the ECI calculation is not impacted by the change in employment levels among occupations and industries which can significantly skew wage levels. It also includes the costs of benefits to employers. The ECI is considered a purer measure of labor costs and is closely watched by the Fed.
The ECI increased 3.1% in Q2 2021 and while that represents solid growth, it remains largely in line with pre-pandemic levels - so it likely won’t raise red flags for the Fed just yet. On a quarterly basis, wages themselves rose just 1.9% year-over-year, significantly lower than pre-pandemic levels and reflective of more lower wage workers returning to work.
What to Watch in the Next Month
- Inflation expectations play a big role in actual inflation. Upcoming surveys of consumers, such as those published by the University of Michigan and the Conference Board, as well as businesses will reveal if the surging delta variant of COVID-19 is impacting the outlook for demand and prices of goods and services.
Next Tracker: September 14, 2021