
CPI, Latest Release, January 2022
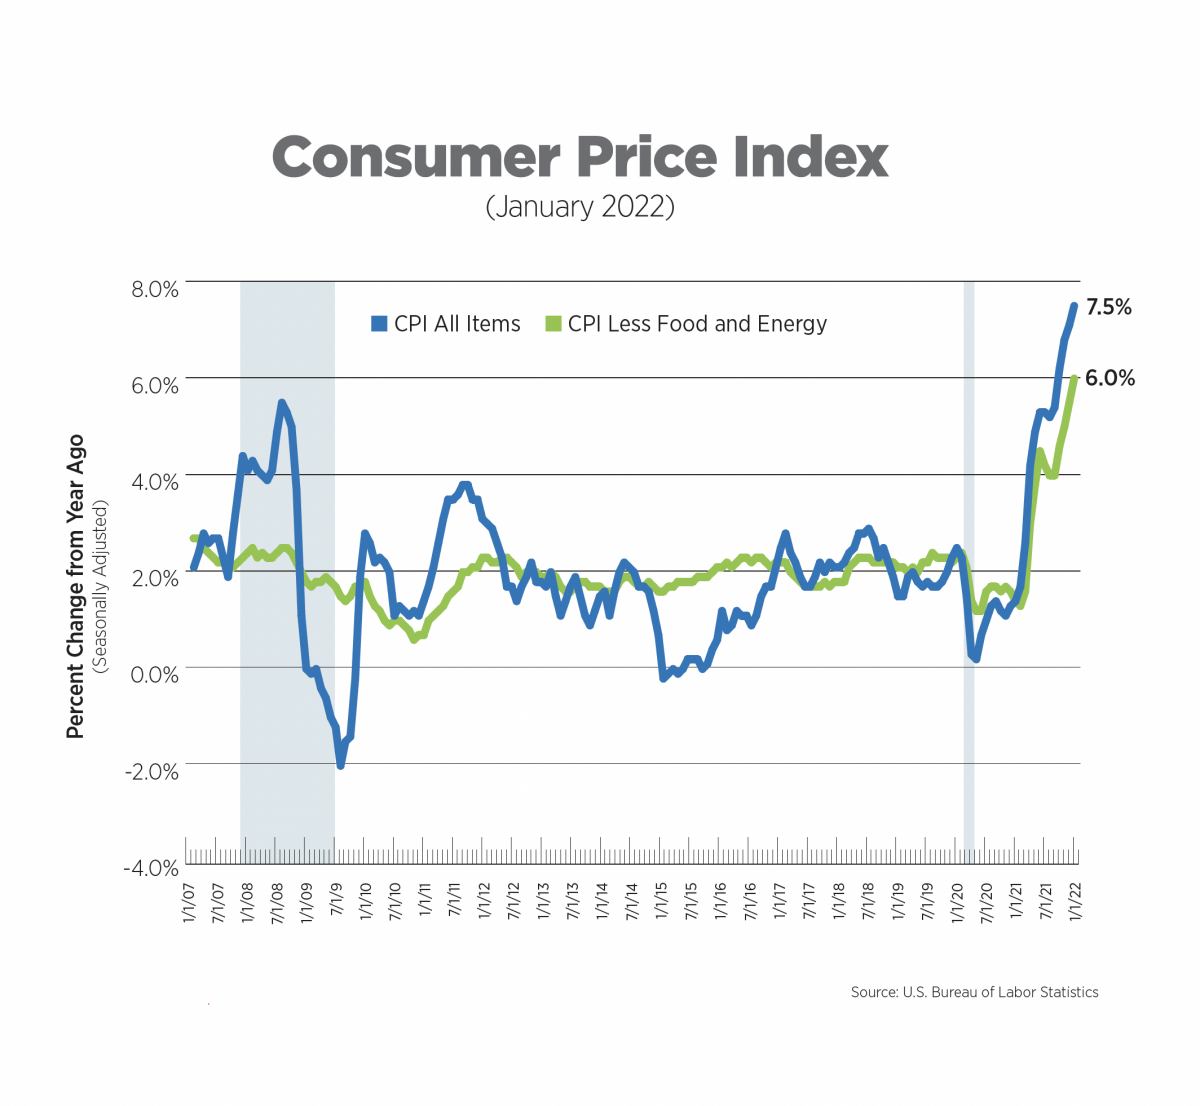
The Consumer Price Index (CPI) increased 7.5% year-over-year while core CPI increased 6.0%. Once again, we must go back to 1982 to find similar figures. Energy prices increased 27% while food prices were up 7.5%. Looking at monthly changes by category can reveal where price pressures may be leveling off or continuing to heat up. Energy prices have increased by less than 1.0% for the past two months after average increases of 2.2% for the prior six months. Food prices, however, continued to rise and experienced their largest monthly increase (1.0%) since the April 2020 lockdowns.
For core CPI, apparel prices and airline fares were on the rise, increasing 1.1% and 2.3%, respectively, in just one month. New vehicle prices, which were skyrocketing month after month last year, experienced their lowest monthly increase of 0.6% since April. Used car and truck prices increased by 1.5%, paling in comparison to 9.2% average monthly increases last Spring.
Inflation has been well above the Fed’s target for months, and with the stunning January Employment Situation Report showing 467,000 jobs added when most economists expected job declines, the Fed now considers the labor market strong. This paves the way for more aggressive interest rate increases in 2022, either by level or frequency or both, to combat inflation.
CPI for Housing, January 2022
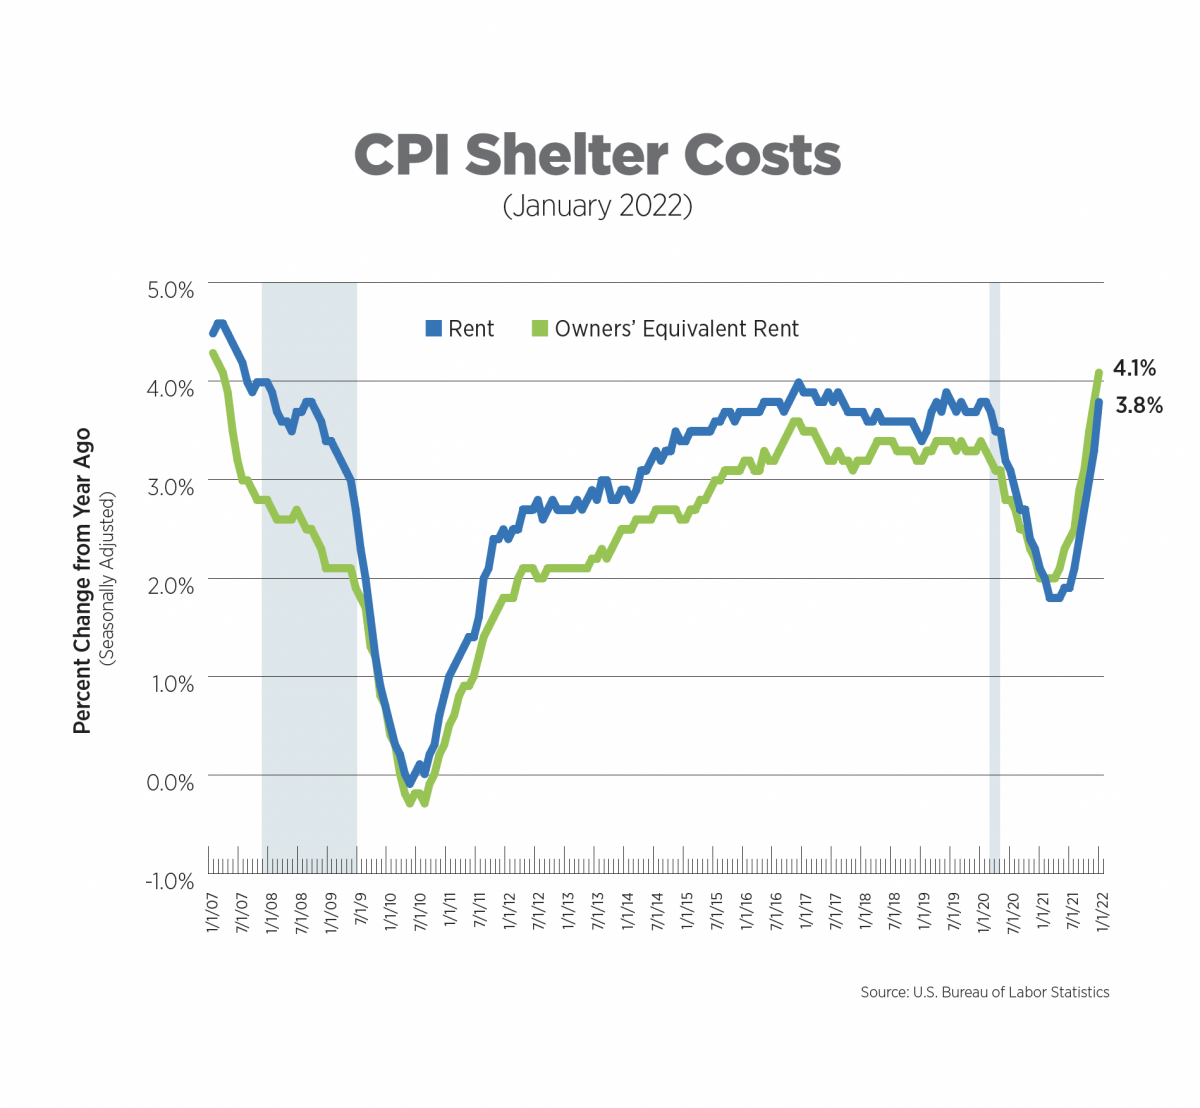
The CPI includes two measures for shelter costs: owners’ equivalent rent and rent of primary residence, both of which are self-reported. Together, they comprise about one-third of CPI. Owners’ equivalent rent, which is the price owner-occupiers think they could attain if they rented their homes, experienced the greatest gain in almost 15 years, rising 4.1% year-over-year. Rent of primary residence posted a 3.8% increase, putting it back to pre-pandemic rates of 2019 and the first two months of 2020.
Alternative Measures of Inflation, December 2021
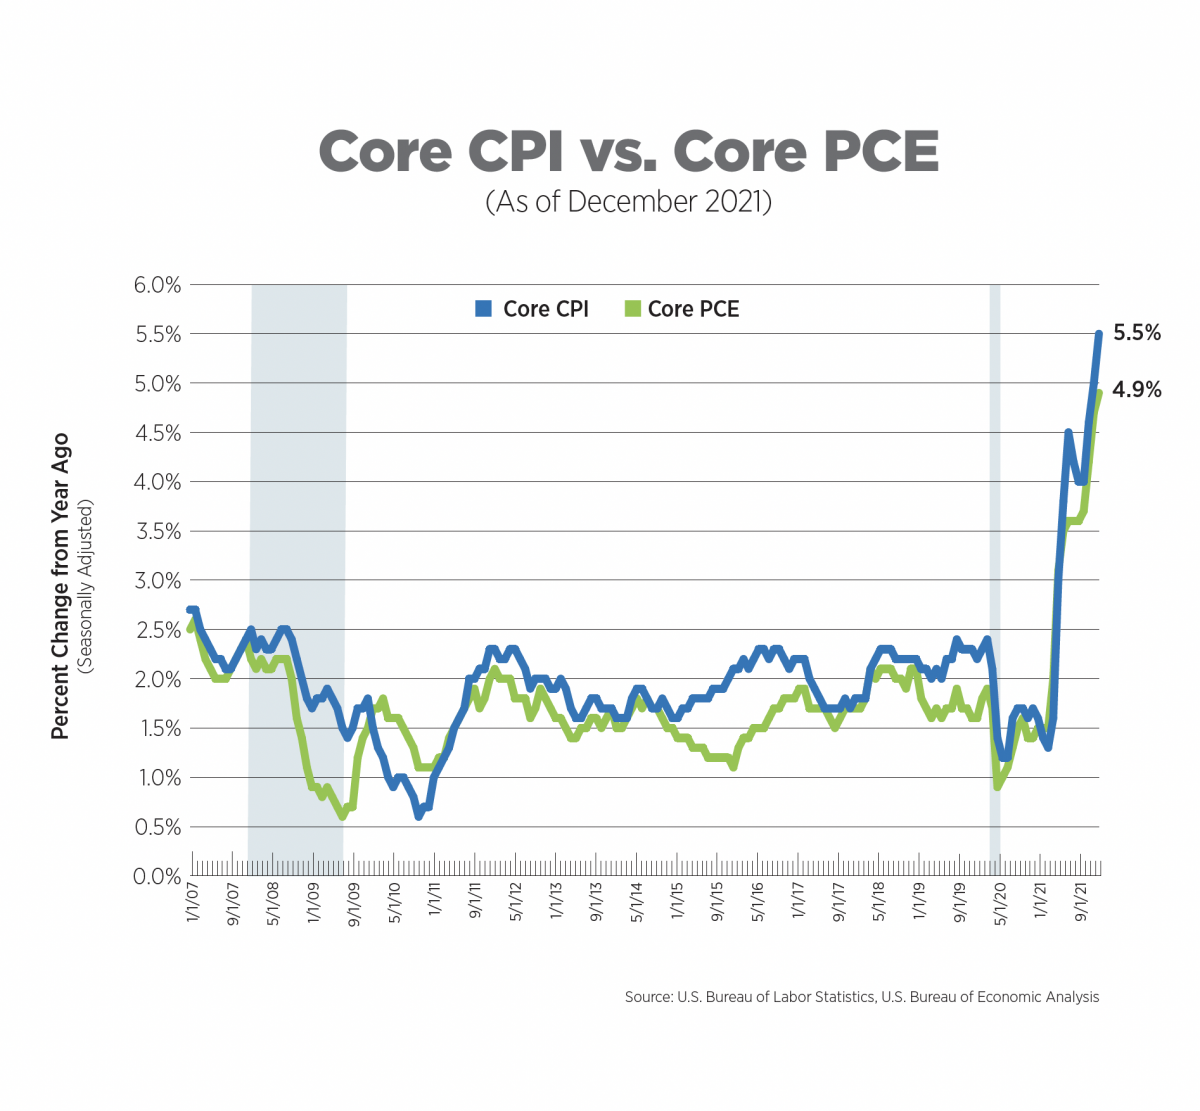
The core Personal Consumption Expenditures (PCE) Index is the measure of inflation the Federal Reserve Bank uses in its policy decisions. It is produced by the Bureau of Economic Analysis and uses different formulas, different weights and has a different scope compared to the Bureau of Labor Statistics’ (BLS) CPI.
The core PCE rose 4.9% year-over-year and 0.5% over the month, still highly elevated but price increases in some categories, such as nondurable goods, have eased from prior months. Once again, durable goods (those with an average useful life of at least three years) were responsible for much of the increase. Overall PCE increased 5.8% year-over-year. Energy goods and services posted a monthly decline of 0.4% after rising 3.6% in November.
Global Supply Chain Pressure Index, December 2021
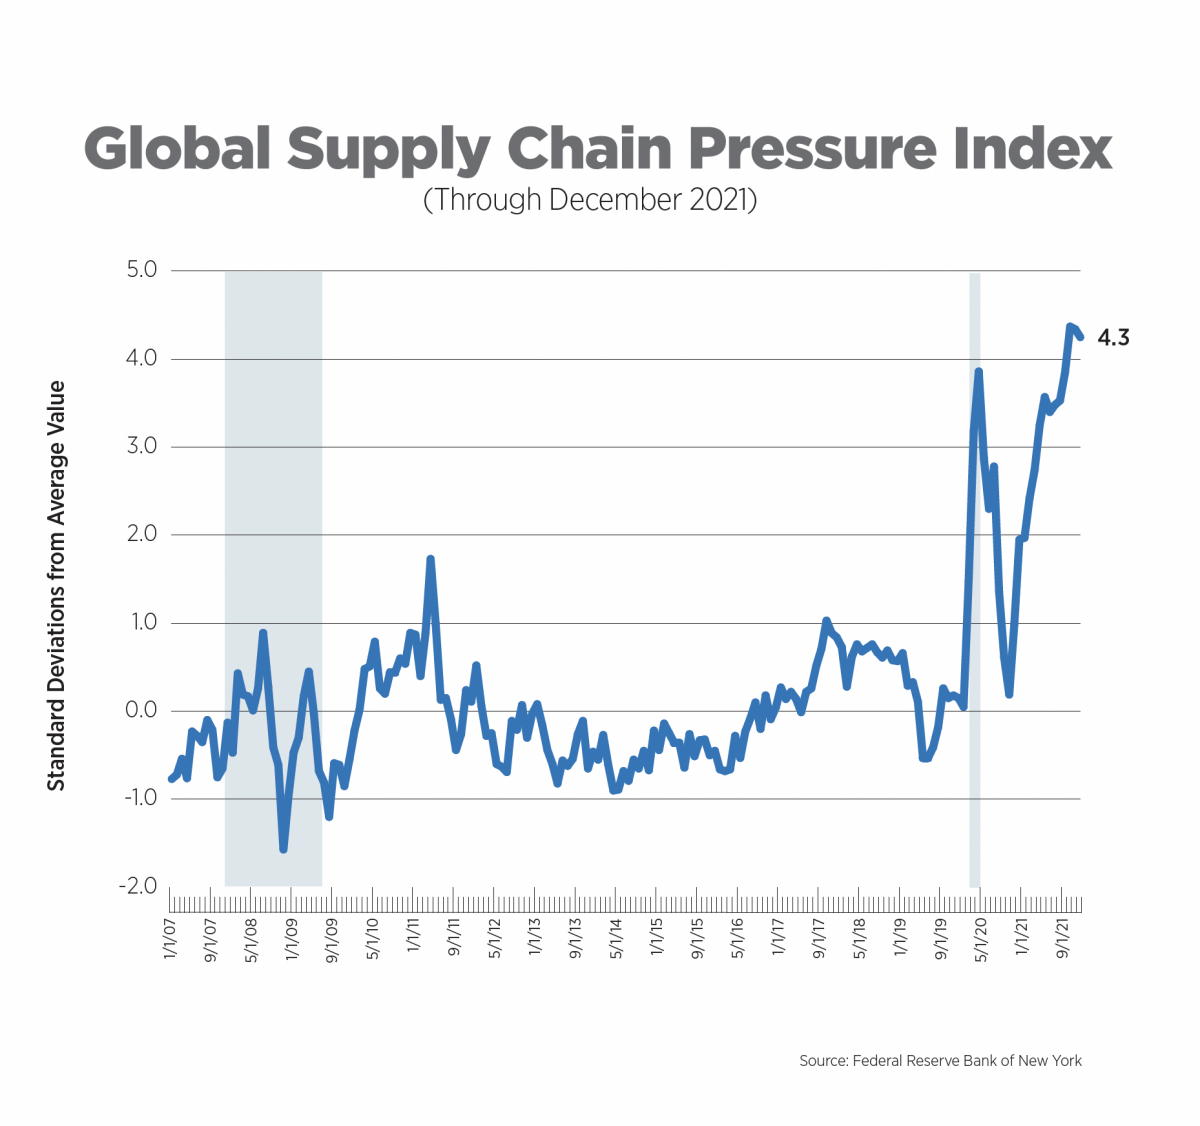
Supply chain pressures are arguably one of the predominant causes of the current spike in inflation. The Federal Reserve Bank of New York created a new index to measure stress in the global supply chain, using 27 variables from different countries, including shipping rates and delivery times. A value of zero indicates average conditions in the supply chain.
As of December, the index appears to have leveled off, with an average measurement of 4.3 for three straight months, which may well indicate a peak. A December survey from the National Association for Business Economics showed a plurality of respondents (43%) expect the supply chain to begin normalizing in the second quarter of this year.
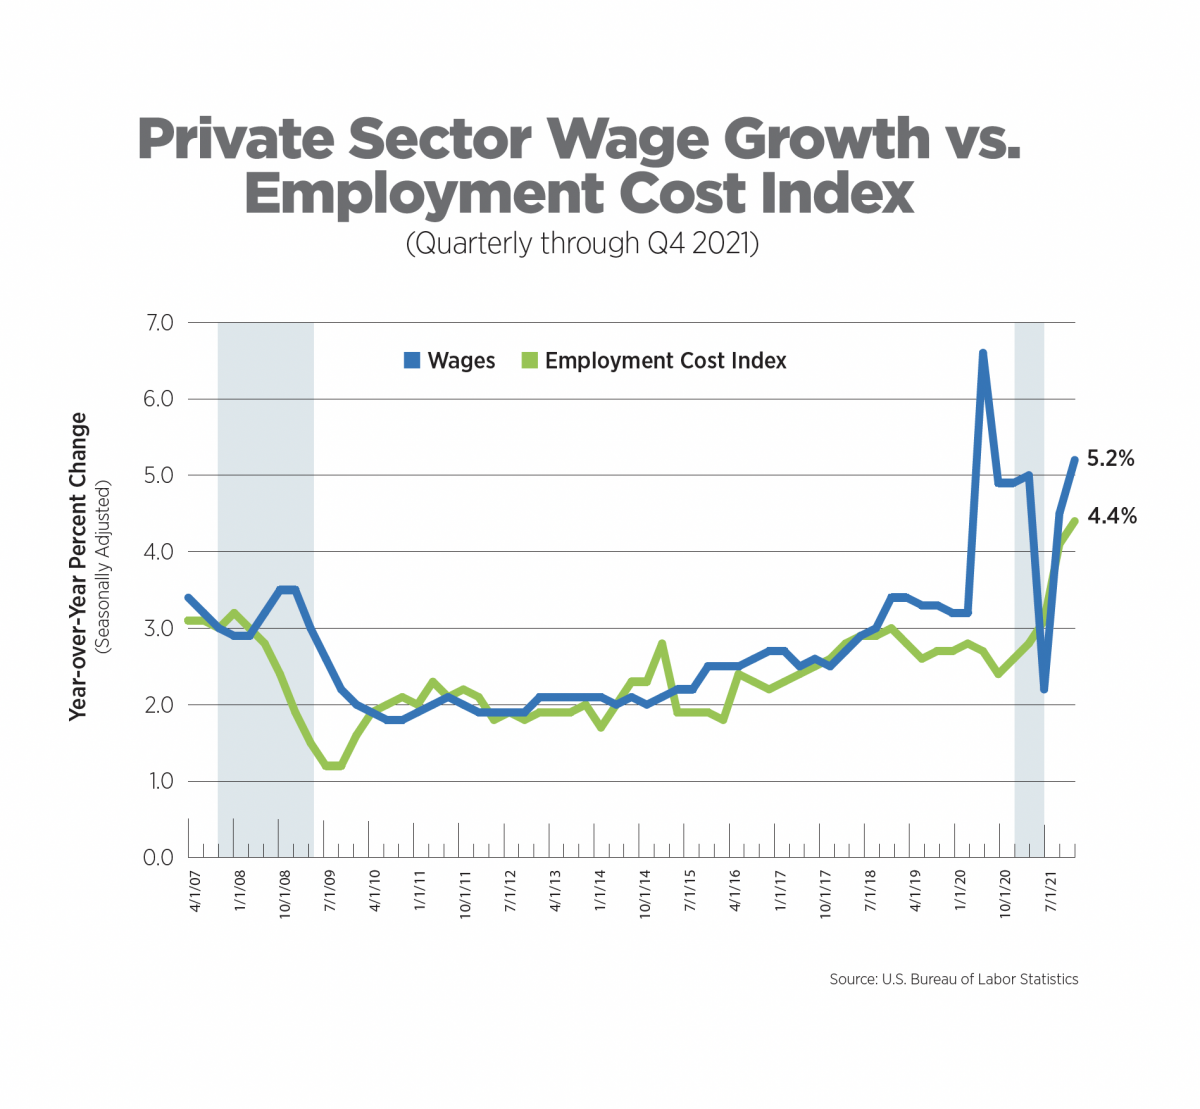
Wage Growth vs. The Employment Cost Index, Q4 2021
The Employment Cost Index (ECI) is a quarterly measure of the change in the costs of labor. Unlike average hourly earnings, the series typically used for wage growth, the ECI calculation is not impacted by the change in employment levels among occupations and industries which can significantly skew wage levels. It also includes the costs of benefits to employers. The ECI is considered a purer measure of labor costs and is closely watched by the Fed.
The ECI for total compensation in the private sector increased 4.4% year-over-year during the fourth quarter of 2021, its highest level since the data series began in 2001. While the increase was mainly driven by wage and salary growth, benefits were at a decade-high, increasing 3.0% since the same period last year. Wage, salary and benefit growth can be expected to continue until the labor market begins to normalize, which is not on the immediate horizon. For the sixth consecutive month, nearly half of all small businesses reported difficulty filling positions, according to the National Federation of Independent Business.
What to Watch in the Next Month
As cases of the Omicron variant continue to decline across much of the country, prompting easing of Covid restrictions, look for further improvements in the labor market in both initial claims for unemployment (released every Thursday) and the February jobs report, due out on March 4.
The next release of CPI will be just before the Fed’s pivotal meeting in mid-March and will greatly influence its policy decision.
Next Tracker: March 10, 2022