
-
The S&P 500 Index registered a 10.4% drop from January through late April, a slide mirrored by the 8.1% decline in the Dow Jones Industrial Average Index. The indices rebounded in early May but remained volatile.
-
Labor markets remained steady during the first quarter. Payroll employment notched steady growth, with 456,000 new jobs added between January and March.
-
While inflation has been on a slowing path, price pressures continue to weigh heavily on American consumers. Both measures of price growth — the Consumer Price Index and the Personal Consumption Expenditures Index — are still above the Federal Reserve’s target of 2.0%.
-
Consumer confidence saw a notable decline in March 2025, reaching the lowest point in 12 years, according to the Conference Board’s Consumer Confidence Index. The trend was also mirrored in the University of Michigan’s Consumer Sentiment Index (see graph), which posted a 34.2% drop in April 2025 compared to a year ago. The decline was driven by worsening consumer perceptions of both current conditions and expectations of changes during the next few months.
Image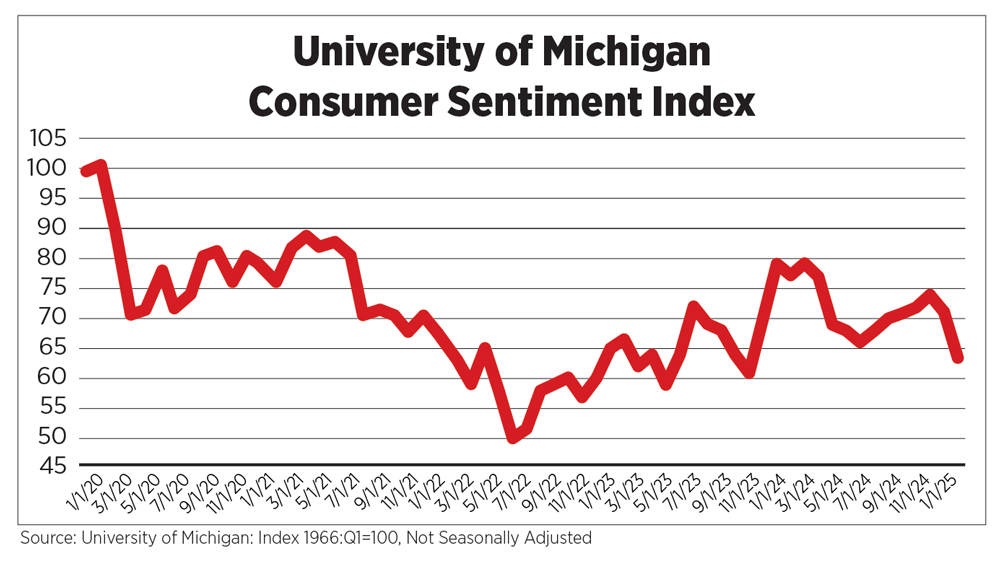
-
The Federal Reserve kept the funds rate steady and maintained a substantial $6.7 trillion balance sheet, mostly holdings of Treasury and mortgage-backed securities. However, in a sign of ongoing monetary tightening, the bank continued shrinking its balance sheet as Treasuries and MBS assets matured.
-
On the last day of April, the Bureau of Economic Analysis released the advanced estimate of gross domestic product for the first quarter of this year. Real GDP declined at an annual rate of 0.3 percent in the first three months. The decline in economic output was driven by a rise in imports, which is calculated as a subtraction from GDP numbers, and a pullback in government spending.
-
Annual absorption reached over 700,000 units – an 18.5% surplus over completions – reflecting a sharp recovery and marking the highest absorption volume since Q1 2022. Year-over-year, this represents a net gain of over 400,000 units.
-
Rent growth rose slightly by 0.2% from the prior quarter, while occupancy rates also moved upward slightly to 95.0%. As demand grows, occupancy is likely to climb in subsequent quarters, reinforcing tightening rental environment and increasing competition among renters.
-
The most significant signal of market caution was the drastic decline in the build-to-rent sales volume—plunging 37.3% year-over-year from over $280 million to $180 million, and an even steeper 78.1% quarter-over-quarter drop from over $820 million in Q4 2024.
-
With new unit construction slowing, occupancy tightening in some markets and falling in others and capital flows under pressure, the BTR sector is entering a pivotal moment. While traditional multifamily continues to benefit from more favorable absorption and pricing metrics, both sectors face looming supply constraints that—if not addressed—could exacerbate affordability and availability challenges.
Read the Spring 2025 Apartment Market Pulse