
While national averages show strong upward movement, metro-level data reveals something more important: Insurance volatility is highly localized. Some markets experienced moderate increases, while others saw dramatic surges that far outpaced the national average of $777 reported in the same dataset.
The geographic concentration of these insurance cost increases reflects how insurers are pricing distinct categories of climate and weather risk. Over the years, Florida and Gulf Coast markets have faced hurricane and flood exposure modeled on increasingly severe storm tracks. Pacific Coast markets, including Seattle, Oakland and Los Angeles, are contending with rising wildfire risk that now extends to urban-adjacent suburban areas. Additionally, a recent GlobeSt. article, “New York's Skyrocketing Insurance Premiums Challenge Property Investments,” by Anthony Russo, highlights how climate-related events such as fires, snowstorms and flooding have driven up insurance premiums in certain markets, which have a ripple effect on potentially reducing property investments and impacting capital expenditure strategies.
Among the 22 markets evaluated in the same-store apartment data from 2021 to 2024, the metro markets with the highest gains in insurance costs were:
- Seattle-Everett, Wash.: Insurance costs per unit jumped from $512 in 2021 to $988 in 2024, a staggering 93% increase. Nearly doubling in three years, this represents the most extreme shift among tracked MSAs.
- Orlando, Fla., experienced an 84% increase. Notably, 2023 alone saw a 45% year-over-year spike.
- Tampa-St.-Petersburg-Clearwater, Fla.: Insurance rose 77% during the four-year period, climbing from about $431 to $760 per unit.
- Washington, D.C.-Md.-Va.: Insurance increased 66%, moving from $375 to about $622 per unit.
- In Houston, the average insurance cost per unit rose from $784 in 2021 to $1,233 in 2024, marking a 57% increase. This makes Houston the market with the highest insurance costs, in absolute terms, among those tracked.
During the four-year period, among West Coast markets captured, Los Angeles-Long Beach and San Diego experienced approximately 61% growth each in insurance premiums, while Oakland, Calif., saw a 58% increase, including a notable 46% year-over-year rise recorded in 2023.
On the other hand, not every metro followed the high-growth trajectory. Chicago’s insurance costs rose just 2% over the four-year period; Salt Lake City-Ogden, Utah, rose by about 12% while Raleigh-Durham-Chapel Hill, N.C., increased a more moderate 29%. These markets underscore that insurance cost pressure is not universal; it is highly exposure-driven and region-specific.
Broader Market Data Reinforces Metro-Level Patterns
Data from more than 90 metropolitan areas, gathered from commercial real estate loan portfolios and Census Bureau provide further evidence that real property insurance costs have risen rapidly in many U.S. cities from 2019–2024. This data shows that insurance costs per unit in 2024 vary widely across core-based statistical areas.
Some of the highest insurance cost markets, out of the 94 core-based statistical areas analyzed, include: Miami-Fort Lauderdale-West Palm Beach, Fla. ($2,175 per unit); New Orleans ($2,020 per unit); Baton Rouge, La. ($1,640 per unit); Beaumont-Port Arthur, Texas ($1,633 per unit); and Jacksonville, Fla. ($1,461 per unit). In contrast, lower-cost markets such as Tucson, Ariz. ($299 per unit); and Toledo, Ohio ($329 per unit) continue to report significantly lower annual insurance premiums per unit.
Several of these markets have also experienced some of the fastest insurance cost growth since 2019, with increases exceeding 150% in certain coastal regions. From 2019 to 2024, Florida and Texas markets, along with several others, experienced the greatest increases in average real property insurance expenses and the chart below compares the growth in those markets to their sustained rent growth.
The chart illustration below comparing high insurance cost markets and their corresponding effective rent growth does not establish causation. Several of the markets with the highest insurance costs also experienced strong population inflows and demand-driven rent growth during the same period. Disentangling the insurance cost pass-through effect from broader demand fundamentals would require a more granular property-level analysis. Nevertheless, the data highlights market intricacies affecting owners' and operators' capacity to adjust rental processes in response to increased cost burdens from insurance premiums and other variables. These findings align with trends identified in same-store benchmarking data, indicating that distinct market conditions, regional risk exposures, and additional factors significantly influence both insurance premiums and rental pricing.
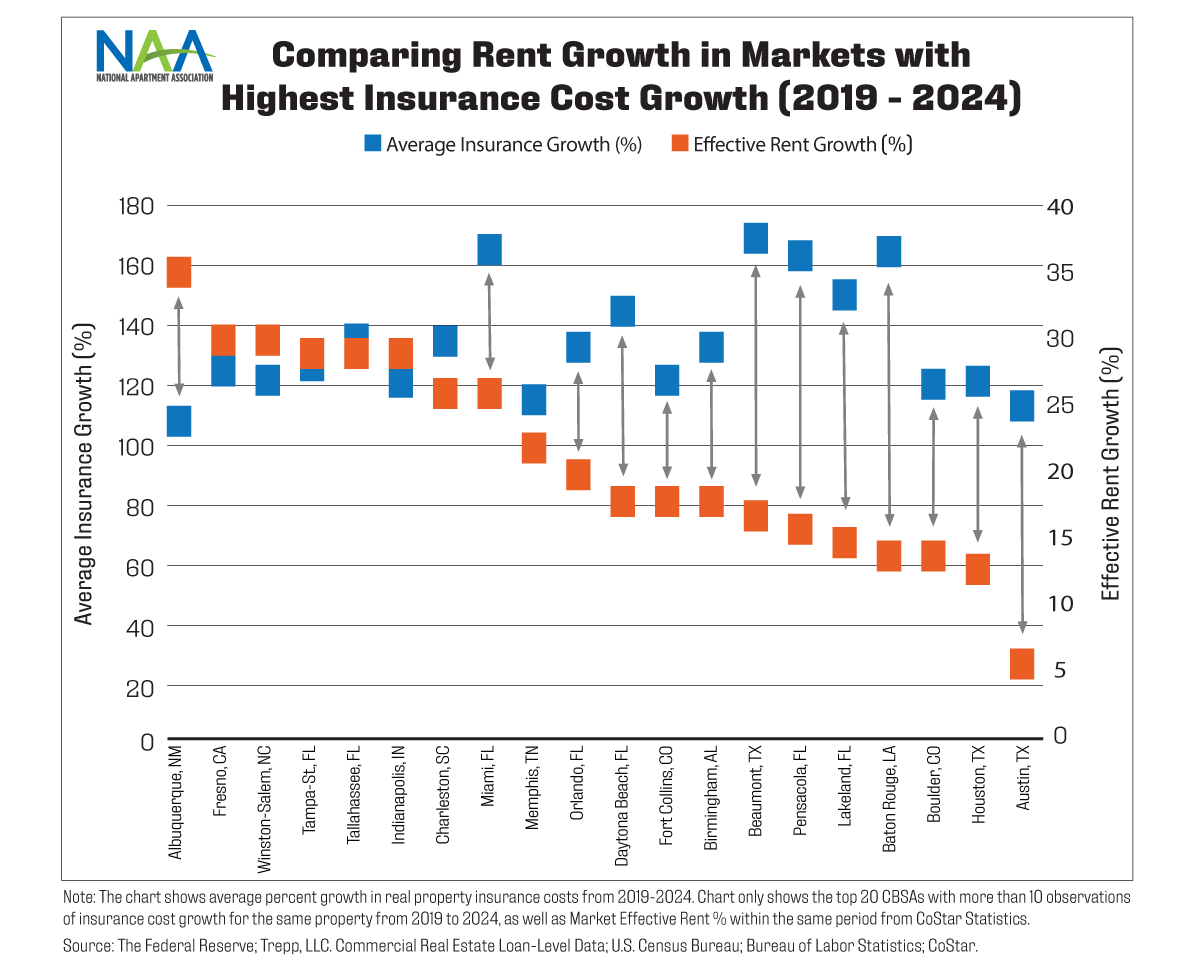
For example, several high-cost insurance markets, including Miami, Fresno, Calif., Tampa and Charleston, S.C., recorded notable rent increases in recent years. In these markets, rising insurance costs are occurring alongside strong demand fundamentals, potentially leading some owners to partially absorb higher operating expenses through rental revenue.
However, the relationship is not uniform across all markets. Some metros with significant cost escalation like Austin, Texas, and Houston have experienced more moderate rent growth compared to other metros, limiting operators’ ability to offset rising expenses though rental revenue gains. In markets where rent growth is constrained, whether by market conditions or by public policy, rising insurance costs compress NOI directly. This places greater financial pressure on smaller owners and properties with thinner operating margins and raises questions about the long-term sustainability of rental housing supply in markets where costs are rising faster than revenues.
Harmful Impact of Rent Regulation in a High-Cost Insurance Environment
The insurance cost data in this article sheds light on important considerations for the ongoing policy debate around rent stabilization and rent control in many of the markets facing the highest insurance cost pressures. Rental housing providers rely on the ability to adjust rents to cover shifting market dynamics and rising operating costs, including insurance. When policies restrict this flexibility, housing providers are unable to offset the financial impact of volatile input costs through rental revenue.
In markets with strict rent regulation policies, an owner experiencing a 50% to 80% increase in insurance costs over three years has limited options to recover those expenses. Annual rent adjustment allowances, often tied to general inflation indices, do not account for the unique and unpredictable nature of the insurance market.
For larger rental housing providers, this may result in reduced returns or delayed reinvestment in properties. For smaller, independent rental owners, who own a significant share of the nation’s naturally occurring affordable housing, the impact can be far more severe. Deferred maintenance, declining property quality or even exiting the rental market altogether are real risks. These outcomes ultimately harm the renters that rent regulation policies aim to protect and further worsen housing affordability.
Policymakers considering, expanding or maintaining rent regulation should carefully evaluate these dynamics. As insurance costs become a more volatile operating expense, the need for market-responsive rent flexibility becomes increasingly important for maintaining quality housing, supporting investments and serving renters across all income levels.
Key Takeaways from Metropolitan Insurance Trends
National averages conceal the considerable challenges faced by multifamily property owners in high-risk areas. Of the 94 metropolitan areas analyzed in the Federal Reserve study, 29 reported more than 100% growth in real property insurance costs between 2019 and 2024. The most pronounced increases were observed in southern and southeastern markets such as Florida, Texas, Louisiana, and the Carolinas. Furthermore, West Coast cities in California, Washington, and Colorado also recorded significant triple-digit increases in insurance costs.
Geographic diversification is becoming increasingly relevant for portfolio risk management. As insurers adjust pricing based on localized risk factors, owners with geographically concentrated portfolios may face disproportionate exposure to insurance cost volatility. A recent report from Multi-Housing News, “Why Insurance Costs Are No Longer High All Over,” notes that some insurers have begun adjusting pricing downward in certain high-risk markets after several years of aggressive increases.
Finally, insurance is becoming a more dynamic component of operating expense forecasting. Historically, insurance premiums tended to increase gradually and predictably. Recent data indicate that this assumption may no longer hold, particularly in markets with heightened exposure to climate risk, severe weather conditions or litigation-driven insurance markets.
Erioreoluwa "Eri" Bajomo is NAA Manager, Industry Research.
Data Sources & Methodology
This analysis is primarily based on two sources. Multifamily housing benchmarking data for apartment properties reporting financial data, examining national and metro-level trends in property, hazard and liability insurance. The multifamily benchmarking data used in this article references the National Summary Income/Expense IQ 2024 and specifically analyzes same-store insurance data of 22 metropolitan markets from 2021–2024, highlighting where premiums are spiking and what owners and managers should watch in 2026.
Additional context incorporates data tracked by the Federal Reserve System and other industry sources.