*User Alert: We've changed our member login. If you have difficulty logging in, click here for help!
The apartment industry marked 2017 with slowing rent growth, a healthy amount of new supply and the leveling of occupancy rates. Data varied across U.S. Census Bureau surveys, but a common thread was a slowing in rental household formation (including single-family rentals). Since its cycle trough of 62.9 percent during the second quarter of 2016, the homeownership rate has crept up ever so slightly and currently stands at 64.3 percent, according to the Housing Vacancy Survey. It’s important to remember that the renter rate of 35.7 percent represents extraordinary growth from the past decade, when 31.9 percent of U.S. households were renters. This equates to 7.7 million new rental households and illustrates continued strong demand among all age cohorts and income levels. In fact, according to the Joint Center for Housing Studies at Harvard University, the greatest increases in the numbers of renters can be attributed to those 65 years and older, and households with income levels above $100,000.
Want to learn the most recent NAA Survey of Operating Income & Expenses in Rental Apartment Communities report? Read the 2019 IES Executive Summary here!
2018 Survey Results
The 2018 NAA Survey of Operating Income & Expenses in Rental Apartment Communities includes financial information for apartment communities with 50 or more units. The analysis in this Executive Summary refers to market rent, individually metered and recovery system properties, 80 percent of the survey responses, unless otherwise noted. More information on the survey, methodology and terms can be found at the end of this summary.
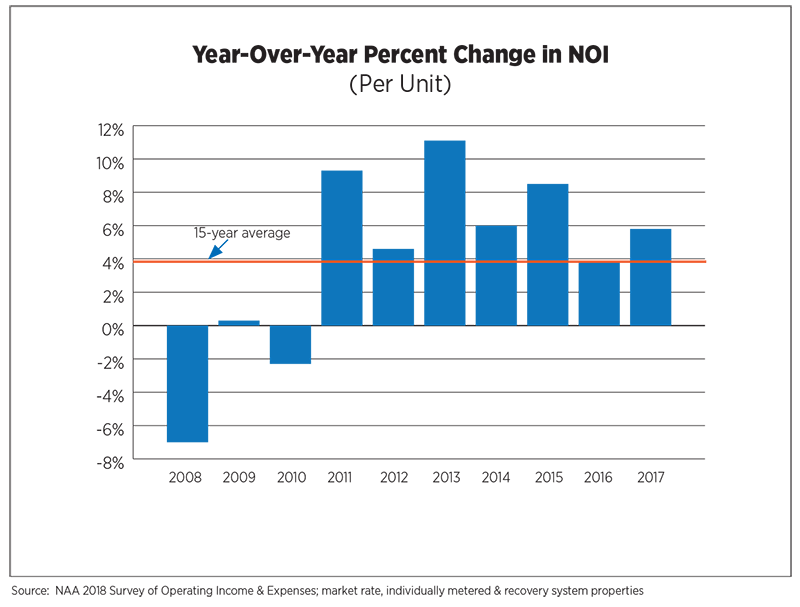
Apartment industry owners and operators stayed lean during 2017, as market deceleration encouraged prudent spending. Operating expenses increased by 2.1 percent, the slowest rate of growth since 2013. Coupled with a jump in ancillary revenues, Net Operating Income (NOI) grew by 5.8 percent, up 2 percentage points over 2016, impressive amid slowing rent growth.
Increases in payroll expenses were in line with wage growth in other private sector industries, averaging 2.4 percent. The number of market-rent garden-style units per full-time employee increased for the third consecutive year to 44.3. The challenges of an ongoing labor shortage within the industry likely kept some communities understaffed throughout the year. Increased pressures on wages can be expected in 2018 and should be evident in next year’s survey results.
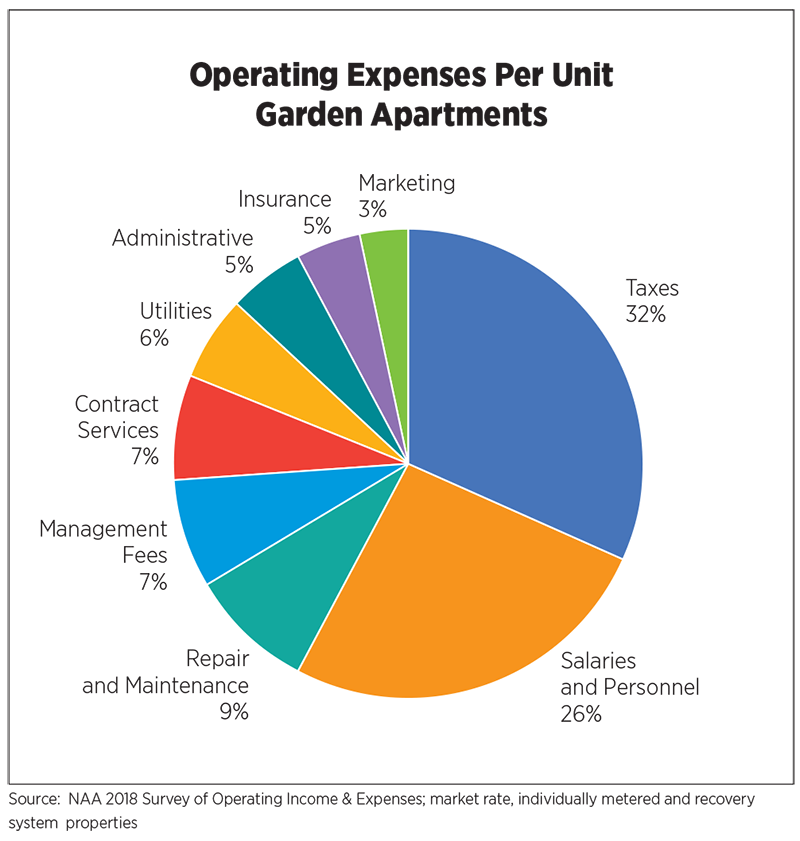
Once again, property taxes were responsible for the largest increase in expenses, up 5.3 percent year-over-year. The average property tax bill was $1,833 per unit and represented one-third of expenses. Fifteen years ago, property taxes comprised less than one-quarter of operating outlays. Contesting assessed values has become commonplace for many owners feeling the squeeze from skyrocketing taxes.
Marketing expenses increased by 4.0 percent, driven by Internet spending, which averaged 36 percent of total marketing costs, an increase of 6 percentage points from last year. Marketing for resident relations (community events, promotional materials for existing residents, etc.) increased slightly while print marketing dropped off, as expected.
Operating Expenses Per Unit Garden Apartments
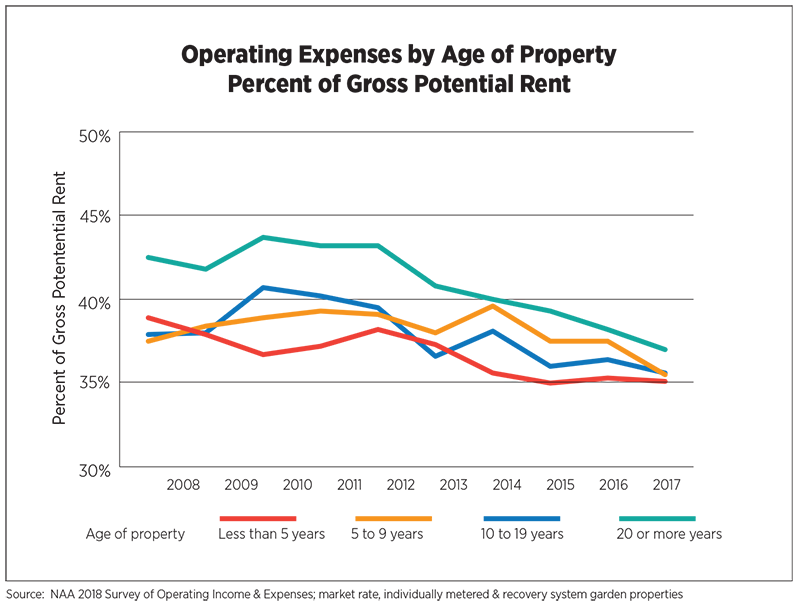
Survey results for market-rent garden properties were also categorized by age of property: Less than 5 years, 5 to 9 years, 10 to 19 years and 20 or more years old. Operating expenses on a dollar-per-unit basis experienced the greatest year-over-year increase in properties 20 or more years old, at 3.4 percent. The gap has narrowed among properties of different ages when measured against Gross Potential Rent (GPR). The fact that older properties’ expenses declined by this measure illustrated the tightness of naturally affordable properties as demand persistently out-stripped supply. The softness in the newer product, much of which is high-end, was also evident in the data, which have been moving sideways for three years.
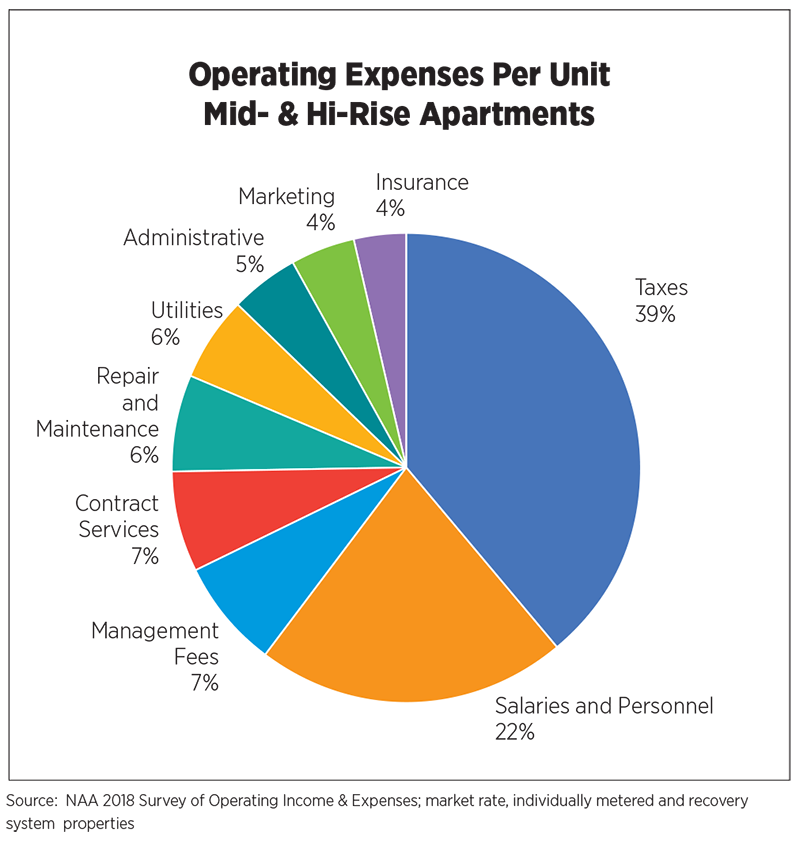
Capital expenditures, which can include anything from concrete and masonry work to amenity upgrades to extensive rehabs of some units or a clubhouse, has steadily increased since 2010 when measured against GPR. At 11.1 percent, it’s at the highest level since 2005. Competition from not only new properties but other highly-amenitized communities has kept the pressure on owners to improve their assets more frequently, and with an eye toward differentiating themselves from their competitors.
On the income side, revenues from rent increased 3.9 percent, the lowest rate in five years and just barely above the long-term average of 3.7 percent. Losses due to concessions experienced an uptick, but represented only 14.3 percent of all lost revenue, with the majority (77.7 percent) a result of vacancies and the remainder to uncollected rent.
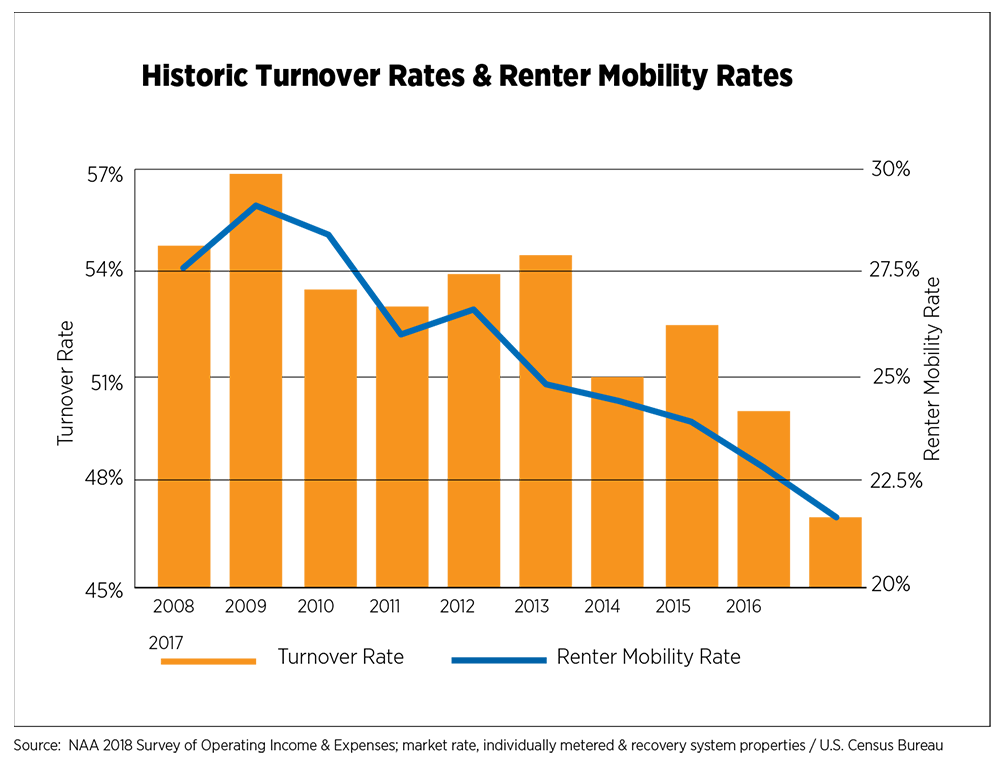
However, turnover rates sank to their lowest point on record (data available from 2000) at 46.8 percent. Owners strived to lower turnover costs by focusing on resident retention and increasing renewal rates. The U.S. Census Bureau reported a similar historic low in renter mobility rates in 2017 (21.7 percent) compared to 35.2 percent in 1988.
Revenue from other sources increased by 11.3 percent in absolute terms, and by 37 basis points when measured against total revenues. In 2017, NAA started collecting specific categories for other revenues to include fees for amenities, laundry, parking, pets and storage. Of the categories identified, both amenity and storage fees increased their shares of other revenue by 5 percentage points and 3 percentage points, respectively. Revenues from parking fees dropped by 1 percentage point and pet fees experienced little change.
The year-over-year increase in operating expenses, 2.1 percent, fell well below the 15-year average of 3.4 percent. Similarly, NOI increased 5.8 percent compared to a 3.8 percent historical average. Anchoring these metrics against GPR and total revenues, respectively, also yielded impressive results.
Operating expenses as a percent of GPR peaked in 2010 at 41.6 percent and steadily declined to 36.9 percent in 2017. NOI as a percent of total revenue steadily increased from 2010 when it was 56.5 percent to 62.3 percent. In the face of slowing market fundamentals, moderate rent growth and increased costs, savvy apartment owners and operators employed revenue management tools and cost-effective measures to ensure continued growth and profitability for the industry.
Metropolitan Area Overview
The full Survey of Operating Income & Expenses includes information on market rate properties for 74 metropolitan areas. This analysis focuses on 40 metro markets originally covered in a study commissioned by the National Apartment Association (NAA) and National Multifamily Housing Council (NMHC) and conducted by Hoyt Advisory Services (HAS): U.S. Apartment Demand – A Forward Look, available at WeAreApartments.org. Based on projected demand, the U.S. will need 4.6 million apartments between 2017 and 2030, about 328,000 per year to keep up with demand. From 2011 to 2016 the industry averaged just 225,000 completions per year.

Total revenue per unit ranged from $10,354 in the relatively affordable Pittsburgh market to $32,358 in pricey San Francisco. Similarly, total operating expenses per unit ranged from $3,650 in Albuquerque to $11,565 in New York City.
Operating expenses as a percentage of GPR from 2016 to 2017 decreased by 0.7 percentage point for the nation. Los Angeles saw the largest increase at 4.7 percentage points, thanks to substantially higher expenses associated with salaries and personnel, as well as taxes. Other metros with large increases in operating expenses included a mix of inland and coastal markets, from Pittsburgh and Chicago to San Francisco and San Diego. Properties in the larger Chicago and San Francisco metros saw higher taxes and properties in Pittsburgh suffered from higher utility costs. Repair and maintenance costs were responsible for a large portion of San Diego’s higher operating expenses.
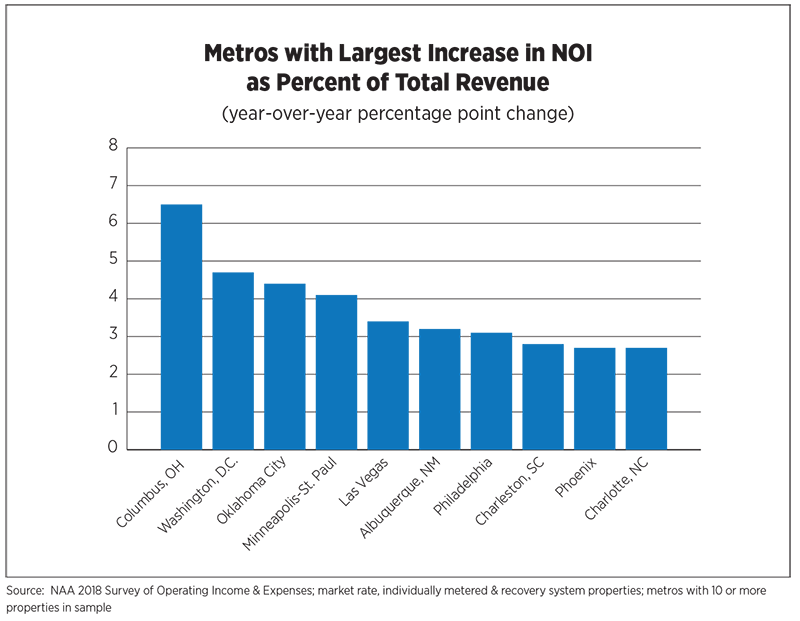
An analysis of 2017 income puts Columbus, Ohio, on top, which experienced a 6.5 percentage point increase in NOI as a percentage of total revenue, the highest growth rate among the 40 metro areas. This was mainly driven by a decrease in losses to vacancy. Columbus’ increase was well above the 0.8 percentage point increase for the nation. Other metros with strong increases included Washington, D.C., Oklahoma City and Minneapolis-St. Paul, which all saw increases above 4 percentage points. Each of these metros experienced lower losses to vacancy, while Washington, D.C., benefitted additionally from fewer losses to concessions.
Outlook
In 2018, the U.S. economy marked its second-longest expansion in history. End-of-cycle projections have been continually debunked by healthy job growth, confident consumers and an exuberant business sector fueled in part by the Tax Cuts and Jobs Act of 2017. More recent indicators including GDP growth surpassing 4 percent for the first time since Q3 2014 suggest an economy that can no longer be described as “plodding along.” Calls for recession in late 2019 to mid-2020 may well be pushed back based on 2018’s performance. The forecast for 4.6 million apartment homes by 2030 is a conservative estimate with two recessions built into the model.
The oldest of the post-Millennial generation, defined by the Pew Research Center as anyone born in 1997 or later and often referred to as “Gen Z,” will be finishing college in 2019 and entering their peak renter years. Population estimates for 2018 to 2030 from the U.S. Census Bureau and Moody’s Analytics project growth of 7.3 million persons in the 25-44 age range, and another 22.1 million in the 65+ category, more of whom are choosing to rent. The broad and diverse appeal of apartments will help offset any demographic shifts among age cohorts in the future.
About the Survey
The survey was conducted, compiled and tabulated by CEL & Associates, Inc. Special thanks to Janet Gora, Managing Director, CEL & Associates, Inc. A total of 3,478 properties containing 891,507 units are represented in this year’s report covering financials from 2017.
Data were reported for 2,967 market-rent properties containing 807,810 units and 511 subsidized properties containing 83,697 units. (Surveys with partial data or apparent problems that could not be resolved were not included.)
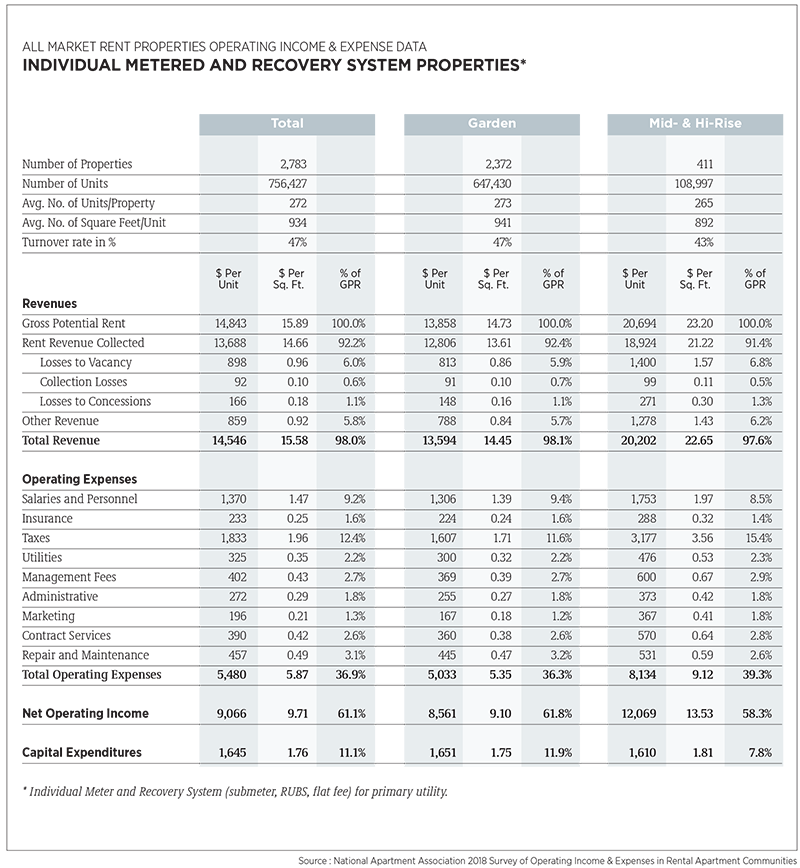
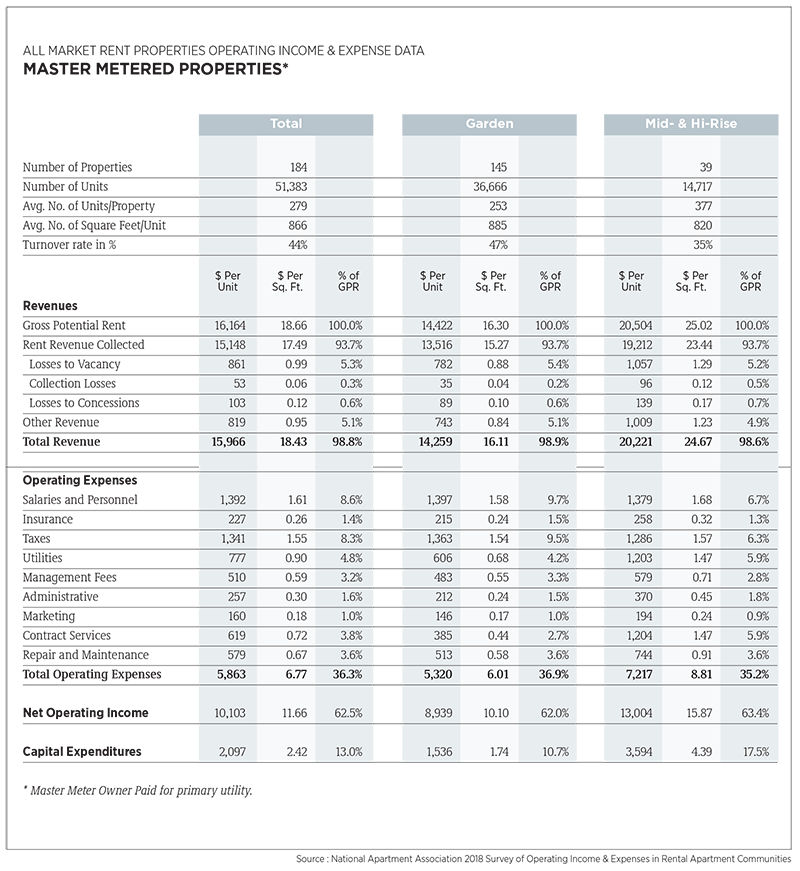
The report presents data from stratifications of garden and mid-rise/high-rise properties; it is further segmented by the individual meter and recovery systems (e.g., submeter, RUBS, flat fee), and master-metered utilities, for the property’s primary utility. Survey data is presented in three forms: Dollars per unit, dollars per square foot of rentable area and as a percentage of gross potential rent (GPR). Responses from garden properties with individual meter/recovery utilities represent 80 percent of the market-rent properties and 67 percent of the subsidized properties. References to statistics within the analysis typically refer to total market rate, individual meter and recovery system properties, except where noted as garden style. The market-rent segment generally has more units per property and greater floor area per unit than the subsidized segment. The average size (# of units) of individual meter/recovery, market-rent properties is 272 units in 2017 (273 in 2016), and 165 units in subsidized properties in 2017 (161 in 2016). Rentable floor area averaged 934 square feet (931 in 2016) for market-rent apartments and 924 square feet (899 in 2016) for the subsidized units.
The full report contains detailed data summarized for NAA’s 10 geographic regions, and 74 metropolitan areas met the separate reporting criteria for market-rent properties. Sufficient numbers of subsidized properties were submitted for 18 metropolitan areas.
This report also includes results for all “other” properties at the state level located in metro areas that did not meet criteria for separate reporting.
Non-metro area reporting also is included at the state level. Tables for these “other” market-rent properties are provided for 22 states and for subsidized properties in 13 states.
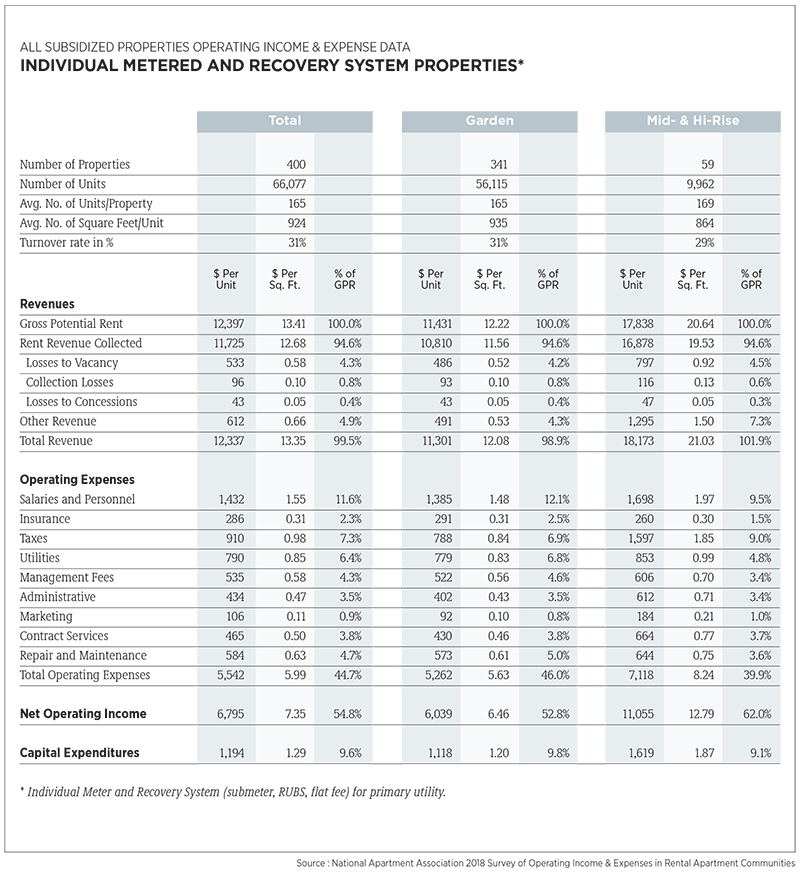
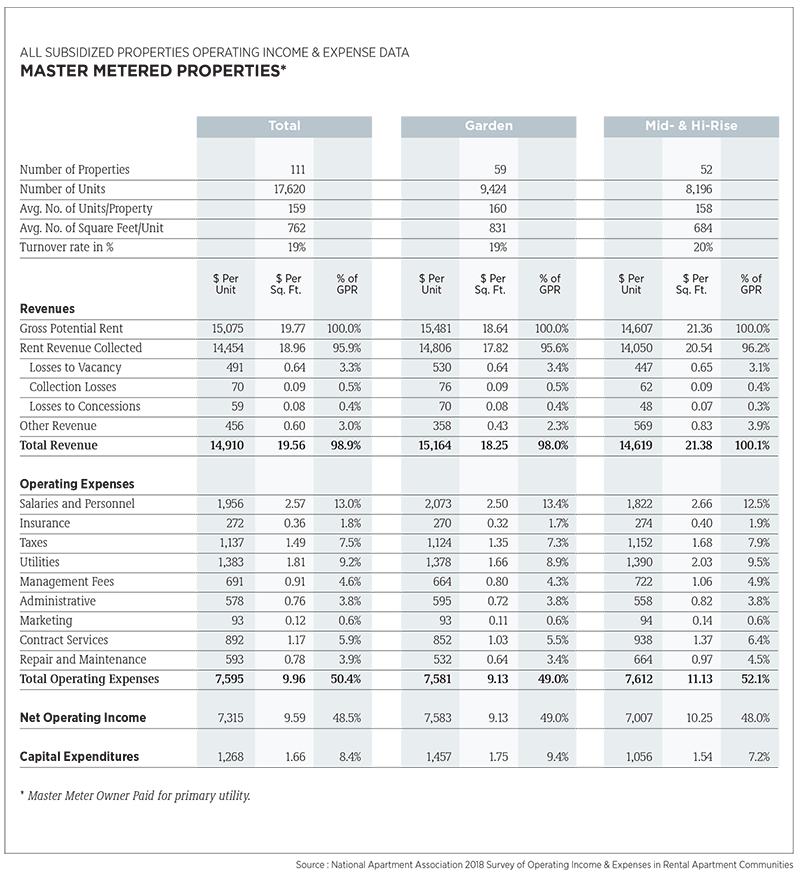
The NAA survey includes standard utilities and distinguishes expenses and recoveries by utility configuration to confirm that net utilities are reported. This level of standard utility expense more consistently represents utilities for comparison between properties. Not all properties are able to designate this detail. Additional reporting for the expanded segmentation areas represents those properties that reported detail. Those that did not were reported as “other.”

Glossary of Terms
Administrative. Total monies spent on general and administrative items such as answering service, donations, mileage reimbursement, bank charges, legal/eviction charges, postage, telephone/fax/Internet charges, office supplies, uniforms, credit reports, permits, membership dues, subscriptions, data processing, etc. Does not include any payroll-related expenses.
Capital Expenditures. Capital Expenditures are separated by the categories listed (renovations, replacements and “other”). All “other” CapEx expenses would include the sum of any items not specifically listed above. A zero on the line meant there were no capital expenditures.
Contract Services. Contract Services are separated by the categories listed (landscaping, pest control, security and “other”). All “other” contract services expenses would include the sum of any items not specifically listed above (ex. Snow removal, and other services provided on a contract basis). Trash removal is not included here.
Gross Potential Rent Residential. Total rents of all occupied units at 2017 lease rates and all vacant units at 2017 market rents (or fiscal year end).
Heating/Cooling Fuel. Type of fuel used in apartment units.
Insurance. Includes property hazard and liability and real property insurance and does not include health/payroll insurance.
Maintenance. Total monies spent on general maintenance, maintenance supplies and uniforms, minor painting/carpeting repairs, plumbing supplies and repairs, security gate repairs, keys/locks, minor roof/window repairs, HVAC repairs, cleaning supplies, etc. Does not include any payroll related expenses or non-recurring capital expenses. Contract services are reported separately.
Management Fees. Total fees paid to the management agent/company by the owner.
Marketing. Marketing expenses are separated by the categories listed (internet, print, resident relations and “other”). All “other” marketing expenses would include the sum of any items not specifically listed above. (i.e.,. locator fees, signage, model expense, etc.) NOTE: rent concessions are not included.
Net Commercial Square Footage. Total rentable square feet of commercial floor space.
Net Rentable Residential Square Feet. Total rentable square feet of floor space in residential units only. Area reported includes only finished space inside four perimeter walls of each unit. Common areas are excluded.
Other Revenue. Monies received are separated by the categories listed (amenity fees, laundry, parking, pet fees, storage and “other”). All “other” would include the sum of any items not specifically listed above. (i.e., vending, deposit forfeitures, furniture, late fees, termination fees, application fees, etc.) NOTE: interest income or utility reimbursements are not included. (Utility reimbursement/recovery is subtracted from gross utility costs.)
Payroll Costs. Gross salaries and wages paid to employees assigned to the property in all departments. Includes payroll taxes, group health/life/disability insurance, 401(k), bonuses, leasing commissions, value of employee apartment allowance, workers’ compensation, retirement contributions, overtime and other cash benefits.
Rent-Controlled Property. A property is subject to rent controls through local or state government regulations. This does not apply if rents are controlled through a government program that provides direct subsidies.
Rental Revenue Commercial. Total rent collections for commercial space after vacancy/ administrative, bad debt and discount or concession losses.
Rental Revenue Residential. Total rent collections for residential units after vacancy/ administrative, bad debt and discount or concession losses.
Revenue Losses to Collections. Amount of residential rents not received due to collection losses.
Revenue Losses to Concessions. Amounts of gross potential residential rents not received due to concessions.
Revenue Losses to Vacancies. Amount of rental income for residential units not collected because of vacancies and other use of units, such as models and offices.
Subsidized Property. A property that has controlled rents through a government subsidized program. (low-income housing).
Taxes. Total real estate and personal property taxes only. Does not include payroll or rendering fees related to property taxes or income taxes.
Tax-Exempt Bond or Housing-Credit Property. A property that has received tax-exempt bond financing and/or is a low-income tax credit property.
Total Operating Expenses. Sum of all operating costs. The sum of all expense categories must balance with this line, using total net utility expenses only. Does not include debt service or any one-time extraordinary costs.
Turnover. Number of apartment units in which residents moved out of the property during the 12-month reporting period.
Utilities. Total cost of all standard utilities and each listed type, net of any income reimbursements for or from residents (i.e., submeter, RUBS, flat fee or similar system).
Utility Configuration. Whether electric, gas, oil and water/sewer utilities to individual units in subject property are: Master Metered, Owner Paid; Master Metered with a Resident Recovery System, (submeter, RUBS, flat fee); Individual Meter, Resident Paid. Report grouping is based on the configuration of the primary utility for the residents.
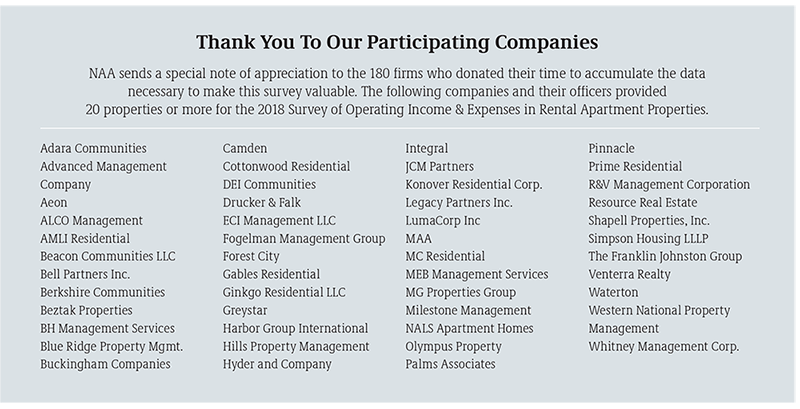
Thank You To Our Participating Companies
NAA sends a special note of appreciation to the 180 firms who donated their time to accumulate the data necessary to make this survey valuable. The following companies and their officers provided 20 properties or more for the 2018 Survey of Operating Income & Expenses in Rental Apartment Properties.
