
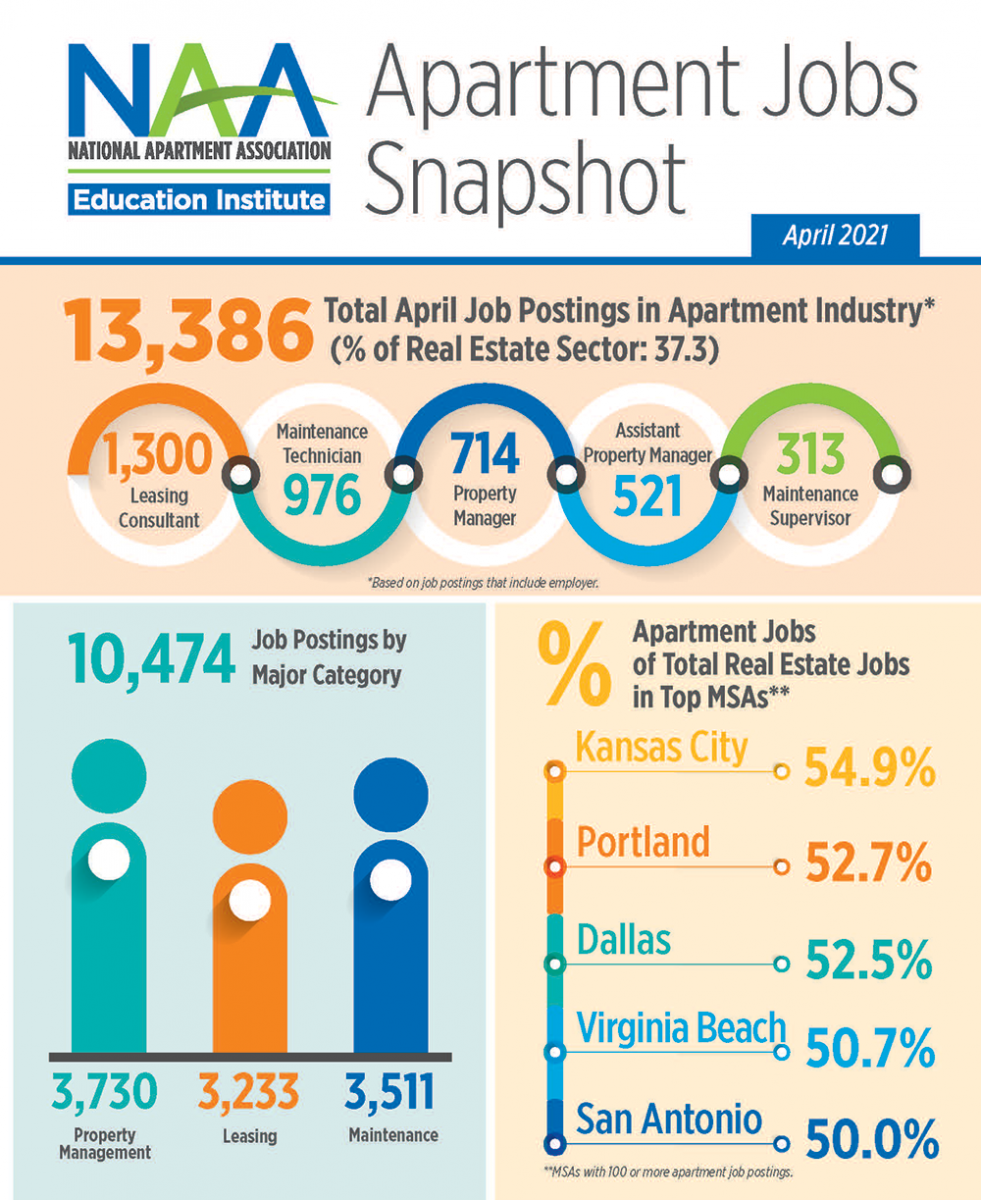
Total April Job Postings in Apartment Industry (1) 13,386
% of Real Estate Sector: 37.3
| Top Job Titles | Number of Postings |
|
Leasing Consultant |
1,300 |
|
Maintenance Technician |
976 |
|
Property Manager |
714 |
|
Assistant Property Manager |
521 |
|
Maintenance Supervisor |
313 |
Job Postings by Major Category
|
Property Management |
3,730 |
|
Leasing |
3,233 |
|
Maintenance |
3,511 |
| Top MSAs (2) | % Apartment Jobs of Total Real Estate Jobs |
|
Kansas City |
54.9% |
|
Portland |
52.7% |
|
Dallas |
52.5% |
|
Virginia Beach |
50.7% |
|
San Antonio |
50.0% |
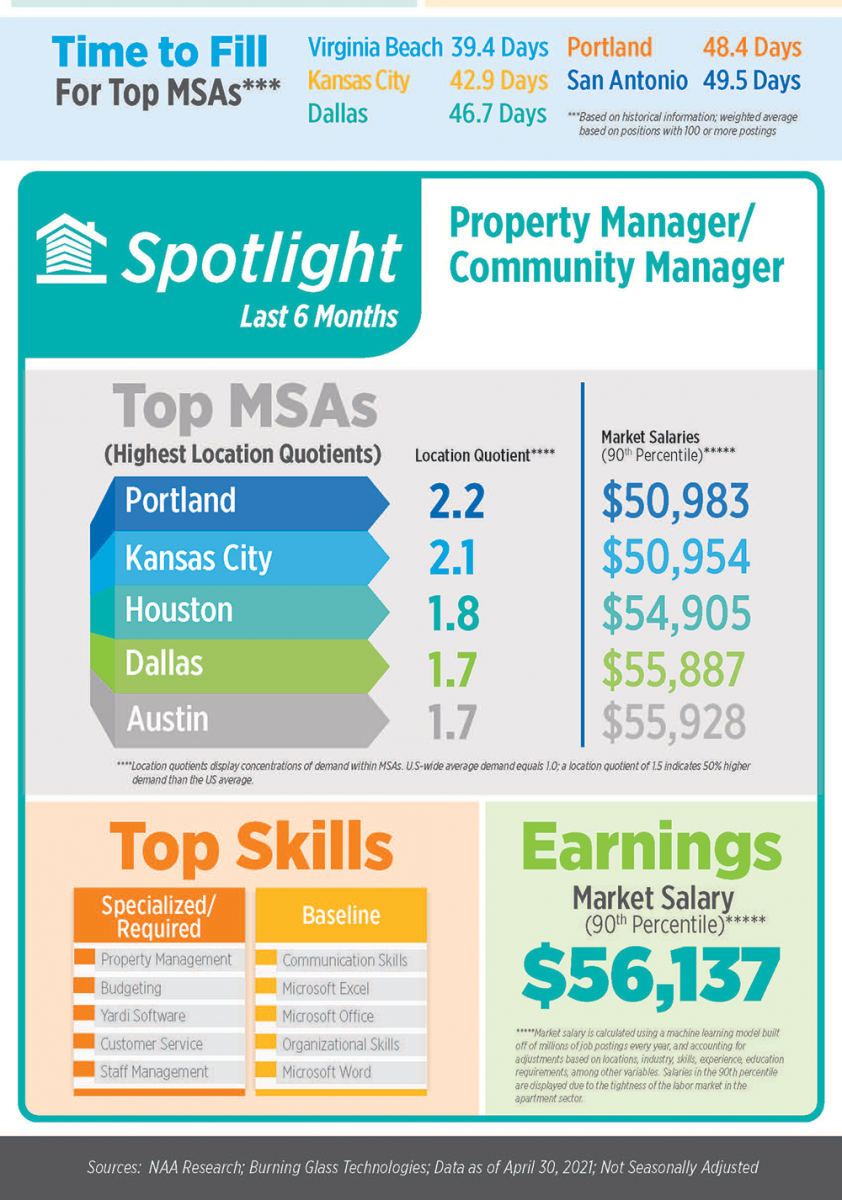
Time to Fill Top MSAs (3)
|
Virginia Beach |
39.4 |
|
Kansas City |
42.9 |
|
Dallas |
46.7 |
|
Portland |
48.4 |
|
San Antonio |
49.5 |
Spotlight On: Property Manager/Community Manager
Last 6 Months
|
MSA |
Location Quotient (4) |
|
Portland |
2.2 |
|
Kansas City |
2.1 |
|
Houston |
1.8 |
|
Dallas |
1.7 |
|
Austin |
1.7 |
Market Salary 90th Percentile (5) $56,137
Market Salaries (90th Percentile) in MSAs with Highest Concentration of Demand
|
Austin |
$55,928 |
|
Dallas |
$55,887 |
|
Houston |
$54,905 |
|
Portland |
$50,983 |
|
Kansas City |
$50,954 |
Top Specialized Skills
- Property Management
- Budgeting
- Yardi Software
- Customer Service
- Staff Management
Top Baseline Skills
- Communication Skills
- Microsoft Excel
- Microsoft Office
- Organizational Skills
- Microsoft Word
1 Based on job postings that include employer.
2 MSAs with 100 or more apartment job postings.
3 Based on historical information; weighted average based on positions with 100 or more postings.
4 Location quotients display concentrations of demand within MSAs. U.S-wide average demand equals 1.0; a location quotient of 1.5 indicates 50% higher demand than the US average.
5 Market salary is calculated using a machine learning model built off of millions of job postings every year, and accounting for adjustments based on locations, industry, skills, experience, education requirements, among other variables. Salaries in the 90th percentile are displayed due to the tightness of the labor market in the apartment sector.
Source: NAA Research; Burning Glass Technologies;
Data as of April 30, 2021; Not Seasonally Adjusted