Here are the top amenities according to owners, developers and designers.
The COVID-19 pandemic has driven rental housing professionals to significantly and consistently adjust operations, and these changes have been witnessed in all aspects of residential real estate, including amenity offerings. In its latest “Multifamily Amenities 2021,” Multifamily Design+Construction reviews the 131 top amenities as evaluated by owners and construction and design professionals.
The majority (53.5%) made no amenity changes due to COVID-19. However, nearly a third of respondents did modify amenities because of the pandemic. Roughly 15% added new amenities, while more than 10% removed amenities due to COVID-19. Among the changes included HVAC upgrades, building material and fixture choices, adding balconies and work-from-home spaces.
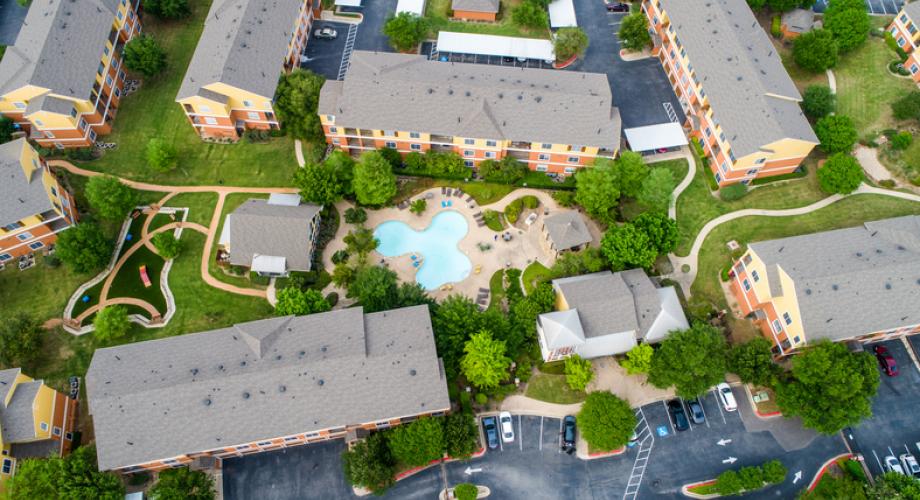
Amenities were categorized by functionality—outdoor, indoor, recreational, technology, etc. The top outdoor amenity remained fire pit/grill, edging out lounge area (66.1% vs. 64%). Lounge area topped the list in 2019. But it’s the 2017 leader, outside unit storage, that has seen a plunge from 62.4% to 44.2% in 2021. Covered parking, outdoor pool and cabanas were also among the top outdoor features.
The top indoor amenity was far and away in-unit washer/dryer at 80%. Lounge was second this year at 68.6%, followed by coffee bar/café at 57.5%. Community kitchen sank more than 12% to 50.3% from 2019 to 2021.
Billiards/pool was the No. 1 recreation amenity in 2021 at 46.5%, ahead of jogging/walking path at 40.9%. The top recreation amenity from 2017, game room/arcade/simulator, fell sharply from 51.6% to 35.8% in 2021.
Bicycle storage (69%) ranked at the top of the convenience services list, only slightly above package delivery (63.6%). Electric vehicle charging was third at 52.1%. Transit access and ridesharing services were also among the top services.
The quality of life amenities list had meeting room/party room as the top feature at 60.3%. Just behind was fitness/Pilates/yoga studio at 59.1%. Recycling service was also among the top vote-getters. Further down the list were spa/health club/sauna and education/lecture program.
Business and technology services were led by conference room at 55.2% Business center was a close second at 52.7%. One surprise finding was free Wi-Fi declining from 59.8% in 2017 to 51.4% in 2019 and 43.6% in 2021. In contrast, paid Wi-Fi increased from 19% in 2019 to 27.1% in 2021.
The top children’s service was playground, more than three time the number of responses as playroom (82% vs. 24.6%). Dogs were king in the top pet services. Dog park was on top of the list at 76.9%, while dog washing station was at 63.1%. Meanwhile, keyless entry topped the security services list at 71%, ahead of video surveillance at 66.8%.
