
News outlets often talk about how rents are at an all-time high. But when you compare rent prices with other data and zoom into individual markets, you get a different, more complex perspective.
To better understand the nuances of housing affordability, we spoke with affordability experts Michael Lim, VP of data science and analytics at TransUnion, and Paula Munger, AVP of industry research and analysis at National Apartment Association. Their data-supported answers shed light on the different factors affecting housing affordability.
Q&A with Paula Munger
Q: What’s driving rent increases across the US in 2022?
A: One significant factor is new home growth isn’t matching economic growth. If you look at statistics from the 1970s, the number of new houses (both for rent and sale) was keeping up with job growth. Since supply and demand were balanced, rent prices were affordable. In contrast, the 2010s saw high growth in new jobs — while growth of new housing plummeted, subsequently driving rent increases.
Q: How do barriers to building correlate to affordability?
A: In a study on exactly that subject, we measured factors like how long it takes for the entitlement process, the number of fees, and how many meetings it takes for things to get off the ground. Our findings revealed cities with more barriers to building are generally less affordable than cities with fewer barriers.
Q: What are some other economic factors affect housing affordability?
A: We looked at data from the Economic Policy Institute on the affordability of food, healthcare and transportation across the US. The data showed areas like New England (where it’s harder to transport food) have higher food costs, while states like West Virginia have higher healthcare costs due to older demographics. And all of the US is experiencing high transportation costs, attributed to the rise in gas prices, along with overall costs of automobile ownership.
Q&A with Michael Lim
Q: Should people only be looking at rent prices when measuring affordability?
A: The short answer is no. When thinking about affordability, it’s important to look beyond just rent prices. According to our data, the US median rent increased 15.7 in the past year. But that’s not the whole story; our data also shows US median income increased by 15.2% — a 0.5% difference. That’s why it’s best to dig deeper into the data instead of fixating on one data point.
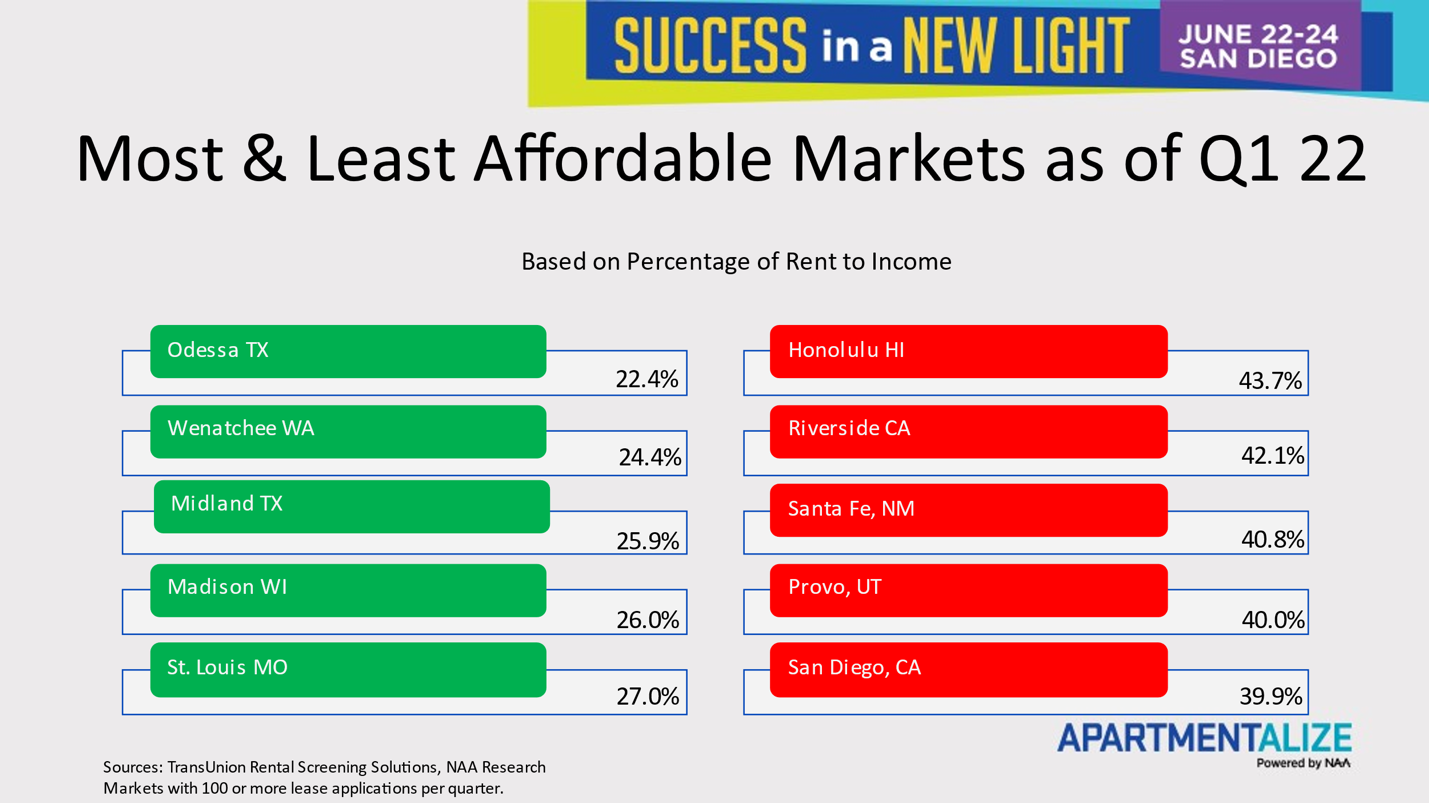
Q: What regions are most affordable — and least
A: Our data shows the least affordable cities are, and have historically been, sunny cities, such as Honolulu, HI; Riverside, CA; and San Diego, CA. A trend we’ve seen increasing since the start of the pandemic is an upsurge in remote workers from colder cities like Chicago moving to warmer cities.
Q: What are contributing drivers of changes in housing affordability?
A: The first is an increase in the number of people moving, which we attribute to the rise of remote work. The second factor is in 2021, we’ve seen one of the hottest housing markets in generations. The state of the housing market led to high demand for rentals and many people selling their homes while the prices were high.
Want to keep up with affordability trends?
NAA is partnering with TransUnion to bring you Affordability Watch — a new quarterly affordability report highlighting insights from across the nation on rent-to-income percentages and changes from market to market.