
Fundamentals are Mixed
U.S Apartment Market
The year is kicking off with an impressive surge in demand, steadily reaching its peak in the past six quarters — surpassing 317,000 annual units absorbed — a notable improvement from negative 197,000 units a year ago. Despite the increase in apartment demand, it continues to lag the pace of supply. Based on RealPage statistics, the gap has narrowed, however, falling 21.3% from Q4 2023 to about 162,000 units.
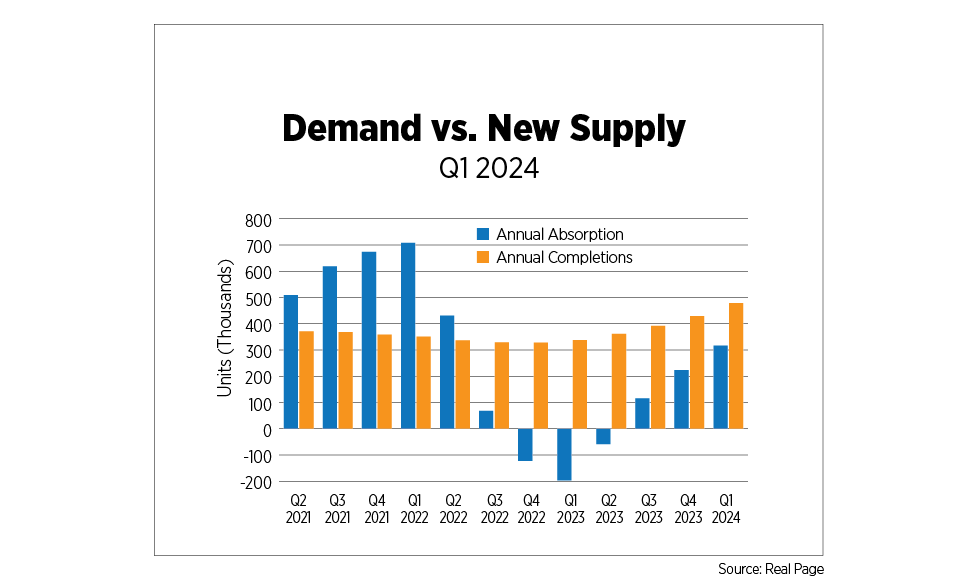
The supply of new apartments remains the dominant factor shaping national performance. For five consecutive quarters, supply has been soaring, reaching as high as nearly 480,000 units at the end of the first quarter, representing a 41.9% annual rise. Annual completions reached their highest point since peaking at approximately 550,000 units delivered in 1986.
An outcome of increasing construction completions would likely be a spike in vacancy rates, creating a ripple effect in the rental housing market. According to CBRE data, the overall multifamily vacancy rate rose 10 basis points less than the previous quarter, but forecasts suggest it will likely rise gradually during the course of the year.
At the market level, about 72.5% of the markets analyzed by CBRE had vacancy rates of 5% or greater, while Madison, Wis., consistently remains the market with the lowest vacancy rate at 2.8%. Among classes, vacancy rates have significantly risen year-over-year. As at the first quarter of this year, the multifamily vacancy rates of Class A, B and C assets were reported at 5.9%, 5.4% and 5.5%, respectively.
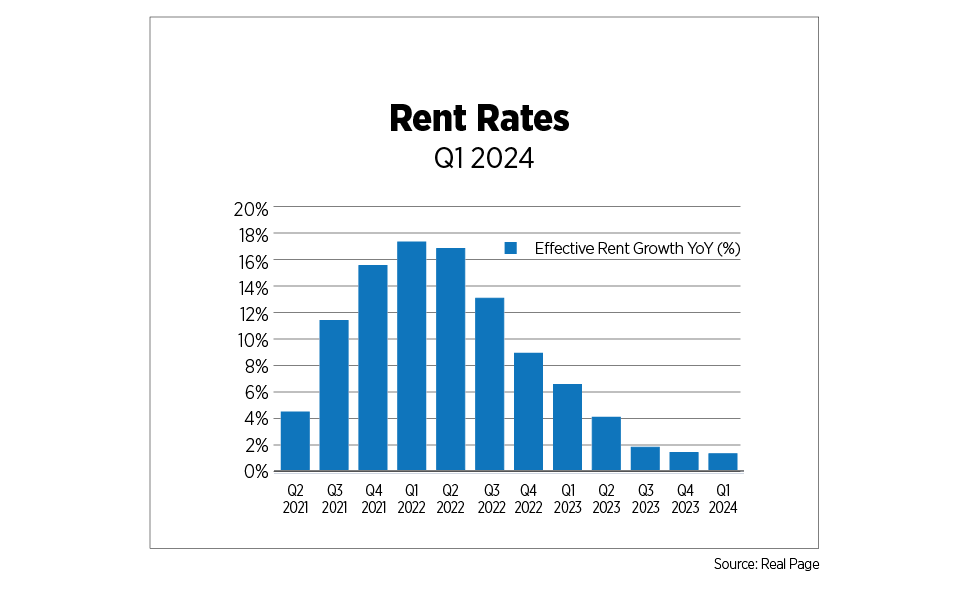
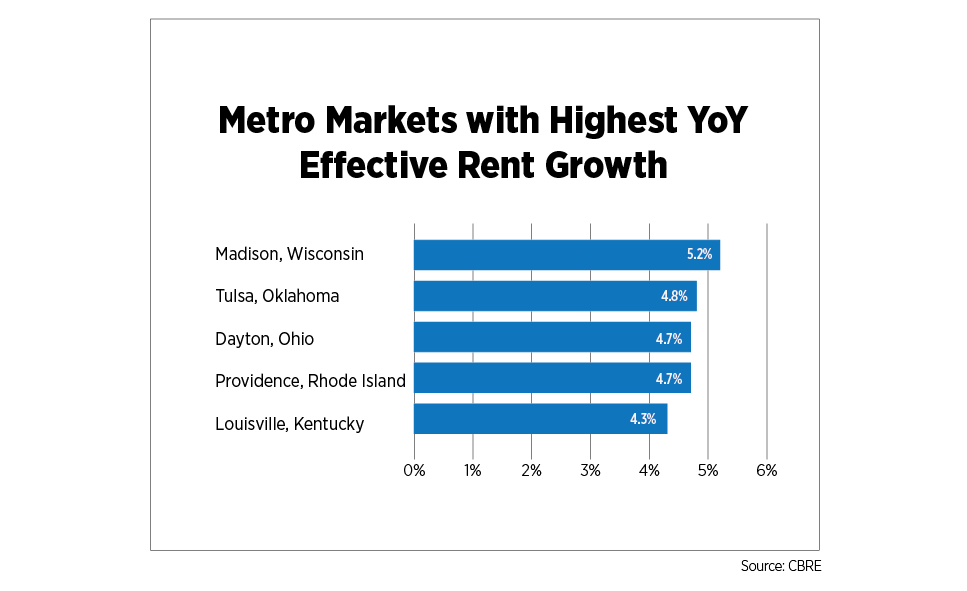
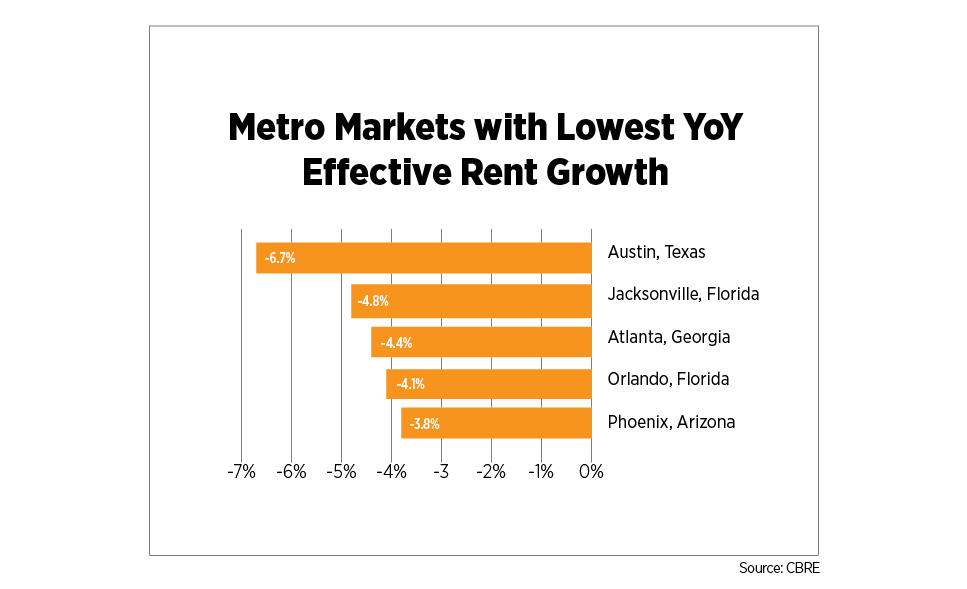
Although overall effective rent growth has dropped by 0.9% to $1,807 since its highest point in Q3 2023, year-over-year growth remains positive at 1.2%. In Q1, average regional rent growth was a blend of both positive and negative values: Midwest (2.7%), Northeast/Mid-Atlantic (2.4%), Pacific (-0.4%), Mountain and Southeast (-1.6%), and South-Central region (-2.0%). About 41% of metro markets tracked by CBRE experienced a year-over-year decline. However, all markets across the Northeast/Mid-Atlantic and Midwest regions exhibited positive trends, with rates ranging from a peak of 5.2% in Madison to a low of 0.6% in Baltimore. The metropolitan areas with the largest effective rent declines were Austin, Texas (-6.7%); Jacksonville, Fla. (-4.8%); Atlanta (-4.4%); Orlando, Fla. (-4.1%); and Phoenix (-3.8%). The bottom three metros retained their rankings from the prior quarter. Conversely, the metro markets with the highest year-over-year rent growth were Madison (5.2%); Tulsa, Okla. (4.8%); Dayton, Ohio (4.7%); Providence, R.I. (4.7%); and Louisville, Ky. (4.3%); with Madison and Providence retaining their rankings from the previous quarter.
U.S. Capital Markets
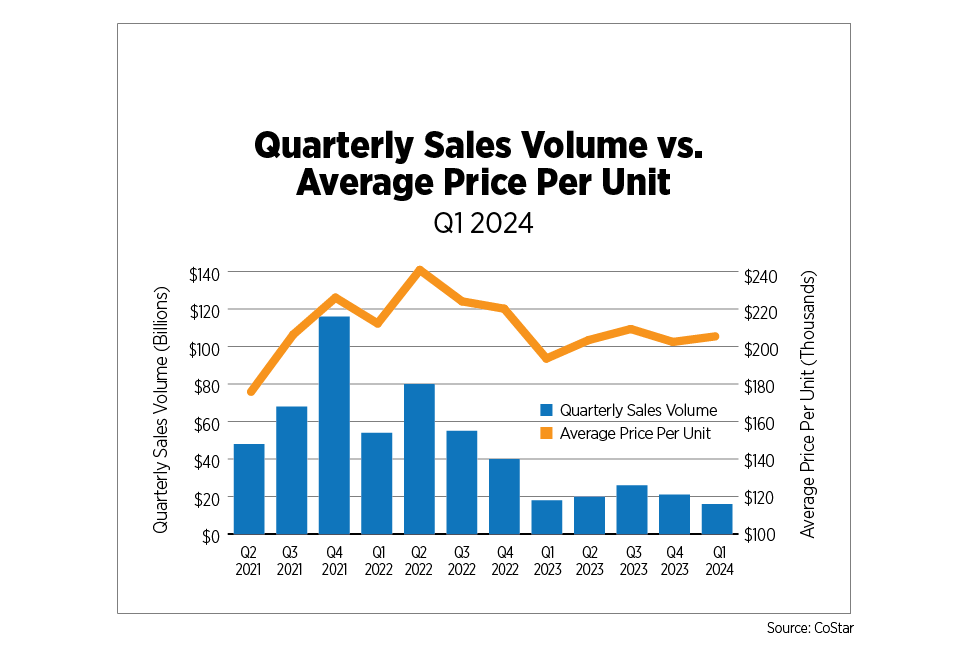
By Q1 2024, apartment sales volume was reported at $15.8 billion, decreasing by 25.4% quarter-over-quarter and 13.8% year-over-year, according to CoStar statistics. The volume of sales has remained low since dropping 49.5% between Q2 2022 and Q4 2022. Higher interest rates and persistently tight lending standards are major contributors to the stagnancy in sales volume.
The national average price per unit for the first quarter was recorded at $206,287, representing a 6.3% annual increase and a 1.5% quarterly increase. California markets (San Jose, Orange County, San Diego and San Rafael) had the highest sales price per unit, ranging between $431,176 and $484,996, while the areas with the highest sales volume, ranging from $634.9 million to about $1.3 billion, were New York, Los Angeles, Denver Washington D.C., and Phoenix.
U.S. Build-to-Rent Market
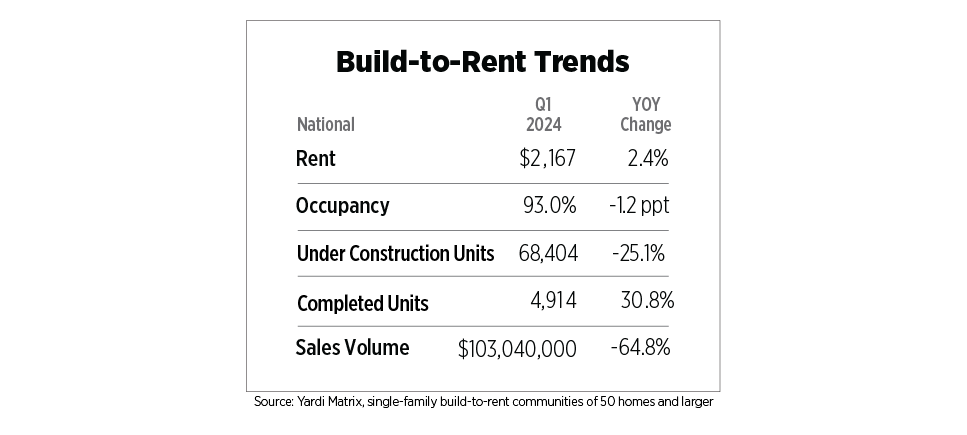
National effective rent growth in Q1 2024 increased to $2,167, showing a 2.4% year-over-year growth. According to Yardi’s single-family build-to-rent (BTR) national trend report, rent has shown a steady upward trend, experiencing a two-year rise of 7.9% and a five-year increase of 36.6%. On the contrary, transaction volume experienced a sharp decline of 64.8% and 52.9% compared to the previous year and previous quarter respectively, a significant slowdown in sales activity which has become the norm across the entire commercial real estate sector.
Housing units under construction decreased 25.1% compared to the preceding year, indicating future declines in deliveries. Units under construction as at the end of Q1 2024 were reported at 68,404 units, marking the lowest production level since Q3 2021. Over the years, the number of existing units in the market has been increasing, reaching its highest level yet of 165,332 units.
Although completed units decreased quarter-over-quarter by 5.9%, Yardi statistics reported a notable year-over-year increase of 30.8% in completions, as units already in the pipeline are still being added to the market. As at Q1 2024, the markets witnessing the greatest number of completed units were Phoenix (899), Salt Lake City (441), Inland Empire (331), West Houston (306) and Atlanta (303).
While the number of completed units increased year-over-year, occupancy on the other hand decreased to 93.0%, marking a decrease of 1.2 percentage points compared to the previous year, its lowest point in over 13 years.
U.S. Economy
Several successive months of high inflation readings have consumers, businesses, and financial markets on edge. The Fed has also expressed concerns, stating it is taking longer to gain confidence that inflation is heading back down to its 2% target. Consequently, it held the Federal Funds Rate at 5.25%-5.5% at the May meeting. Chair Jerome Powell all but dismissed the likelihood of more rate increases, although the probability of rate cuts getting pushed out later this year has increased, adding to the economic angst.
It’s important to note that the Fed’s preferred measure of inflation, the Core Personal Consumption Expenditures Index, has steadily decreased on a year-over-year basis since January 2023, and now sits at 2.8%. But headline CPI is what typically drives the conversation about inflation. Shelter costs continue to be a main driver of the Consumer Price Index with lags in the primary rent measure persisting for longer than was originally anticipated, compared to current market rent trends. In addition, services inflation, which is stickier than goods inflation remains highly elevated at 5.3% year-over-year in March. In contrast, prices for durable goods decreased by 2.1% while prices for nondurable goods were up by just 1.7%.
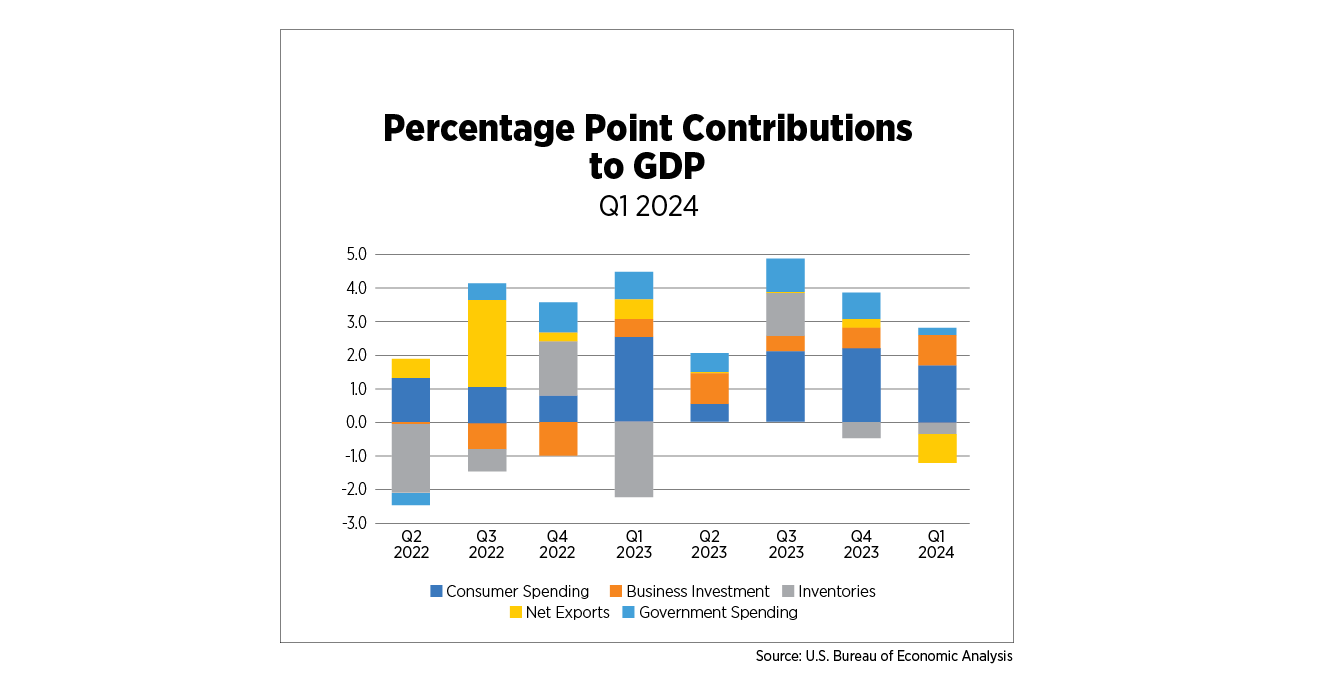
The Bureau of Economic Analysis’s preliminary estimate of Q1 2024 real GDP was lower than expected, rising just 1.6%. Consumer spending added 1.7 percentage points to GDP, essentially responsible for all GDP growth. Business spending contributed the largest percentage point growth to GDP in two years, driven by residential and intellectual property investments. Inventories have been a drag on GDP for the past two quarters, although at a fraction of the magnitude of a year ago, when talks of recession were rampant.
April’s Employment Situation Report, showing 175,000 jobs added, came in lower than expected after averaging 242,000 during the prior 12 months. The unemployment rate ticked up slightly to 3.9%, but marked the 27th consecutive month below 4.0%, a run that has not been achieved since the late 1960s.
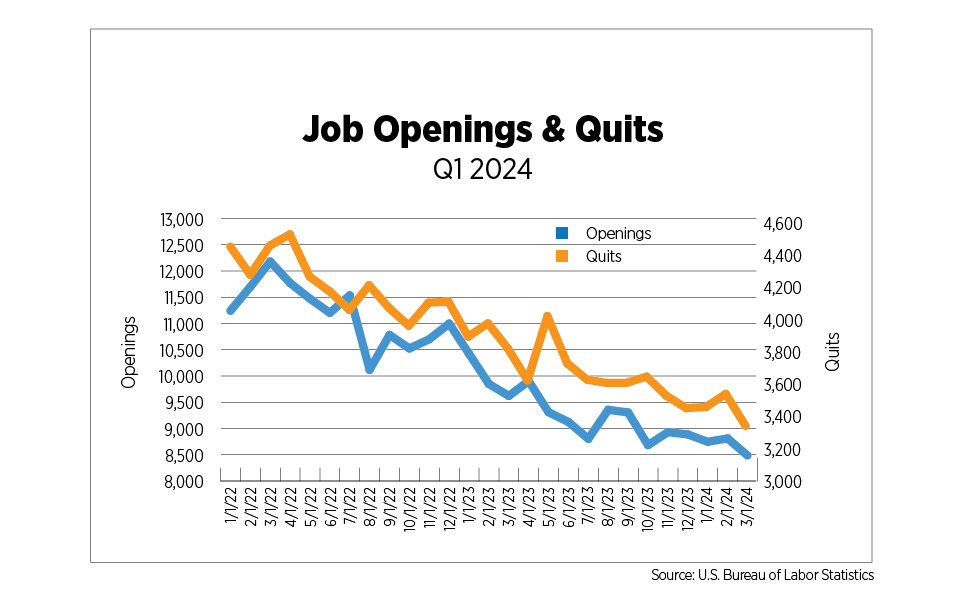
Labor market cooling is also evident in JOLTS (Job Openings and Labor Turnover Survey) data. There are still 1.3 million more job openings than 2019 averages, but they have been steadily trending downward. From a peak of two jobs openings available for every unemployed person, reached during the spring and summer months of 2022, to the current ratio of 1.3 positions per unemployed person, it’s clear that the labor market is beginning to turn. Quit levels are actually below 2019 averages as fewer job openings mean limited opportunities for employees, ultimately leading to hesitation about quitting current positions.
Outlook
Inflation and high interest rates remain two of the few negatives in the economy right now. A potential positive in the April jobs report was wage growth, which fell below 4.0% year-over-year for the first time since June 2021. Although lower wage growth is obviously not ideal for workers and consumers, it is key to managing inflation, as businesses are under less pressure to raise prices on goods and services.
First quarter apartment fundamentals were solid and are a testament to the resilience of the industry amid a challenging financial environment. Job growth and wages, while cooling, are still strong. And adults between the ages of 18-39, prime years for renting, experienced an astounding 80% increase in real wealth since 2019, according to a recent report published by the Federal Reserve Bank of New York.
Elevated operating costs, below-average rent growth and high interest rates are still causing pain, however, impacting net operating income and property values alike. The standstill in capital markets is dampening opportunities for growth, development, repositioning, and diversification within the industry at a time that is critical for housing markets to forge ahead.