
Overview
Most 2024 national apartment market indicators are pointing to a resilient market with sustained demand but lackluster rent growth, which is likely at or near bottom. But looking back at 2023 financial benchmarks revealed yet another challenging year for the rental housing industry, with increases in operating expenses eclipsing rent growth.
The 2023 I/E IQ benchmarks, released in August in collaboration with the Institute of Real Estate Management (IREM) and the Building Owners and Management Association (BOMA), included operating and expenses information for over 900,000 multifamily units in more than 4,000 properties spanning 110 metro markets.
The same-store analysis in this report includes buildings that submitted financial data to the benchmarks in 2021, 2022 and 2023, which number more than 1,500 properties in 29 metro areas. In addition, each market in the same-store sample must contain at least 20 properties to be included in the analysis.
National Results
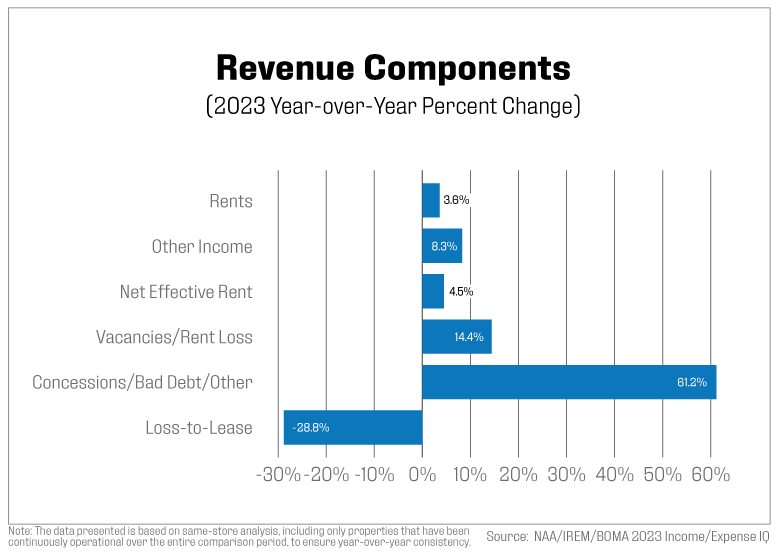
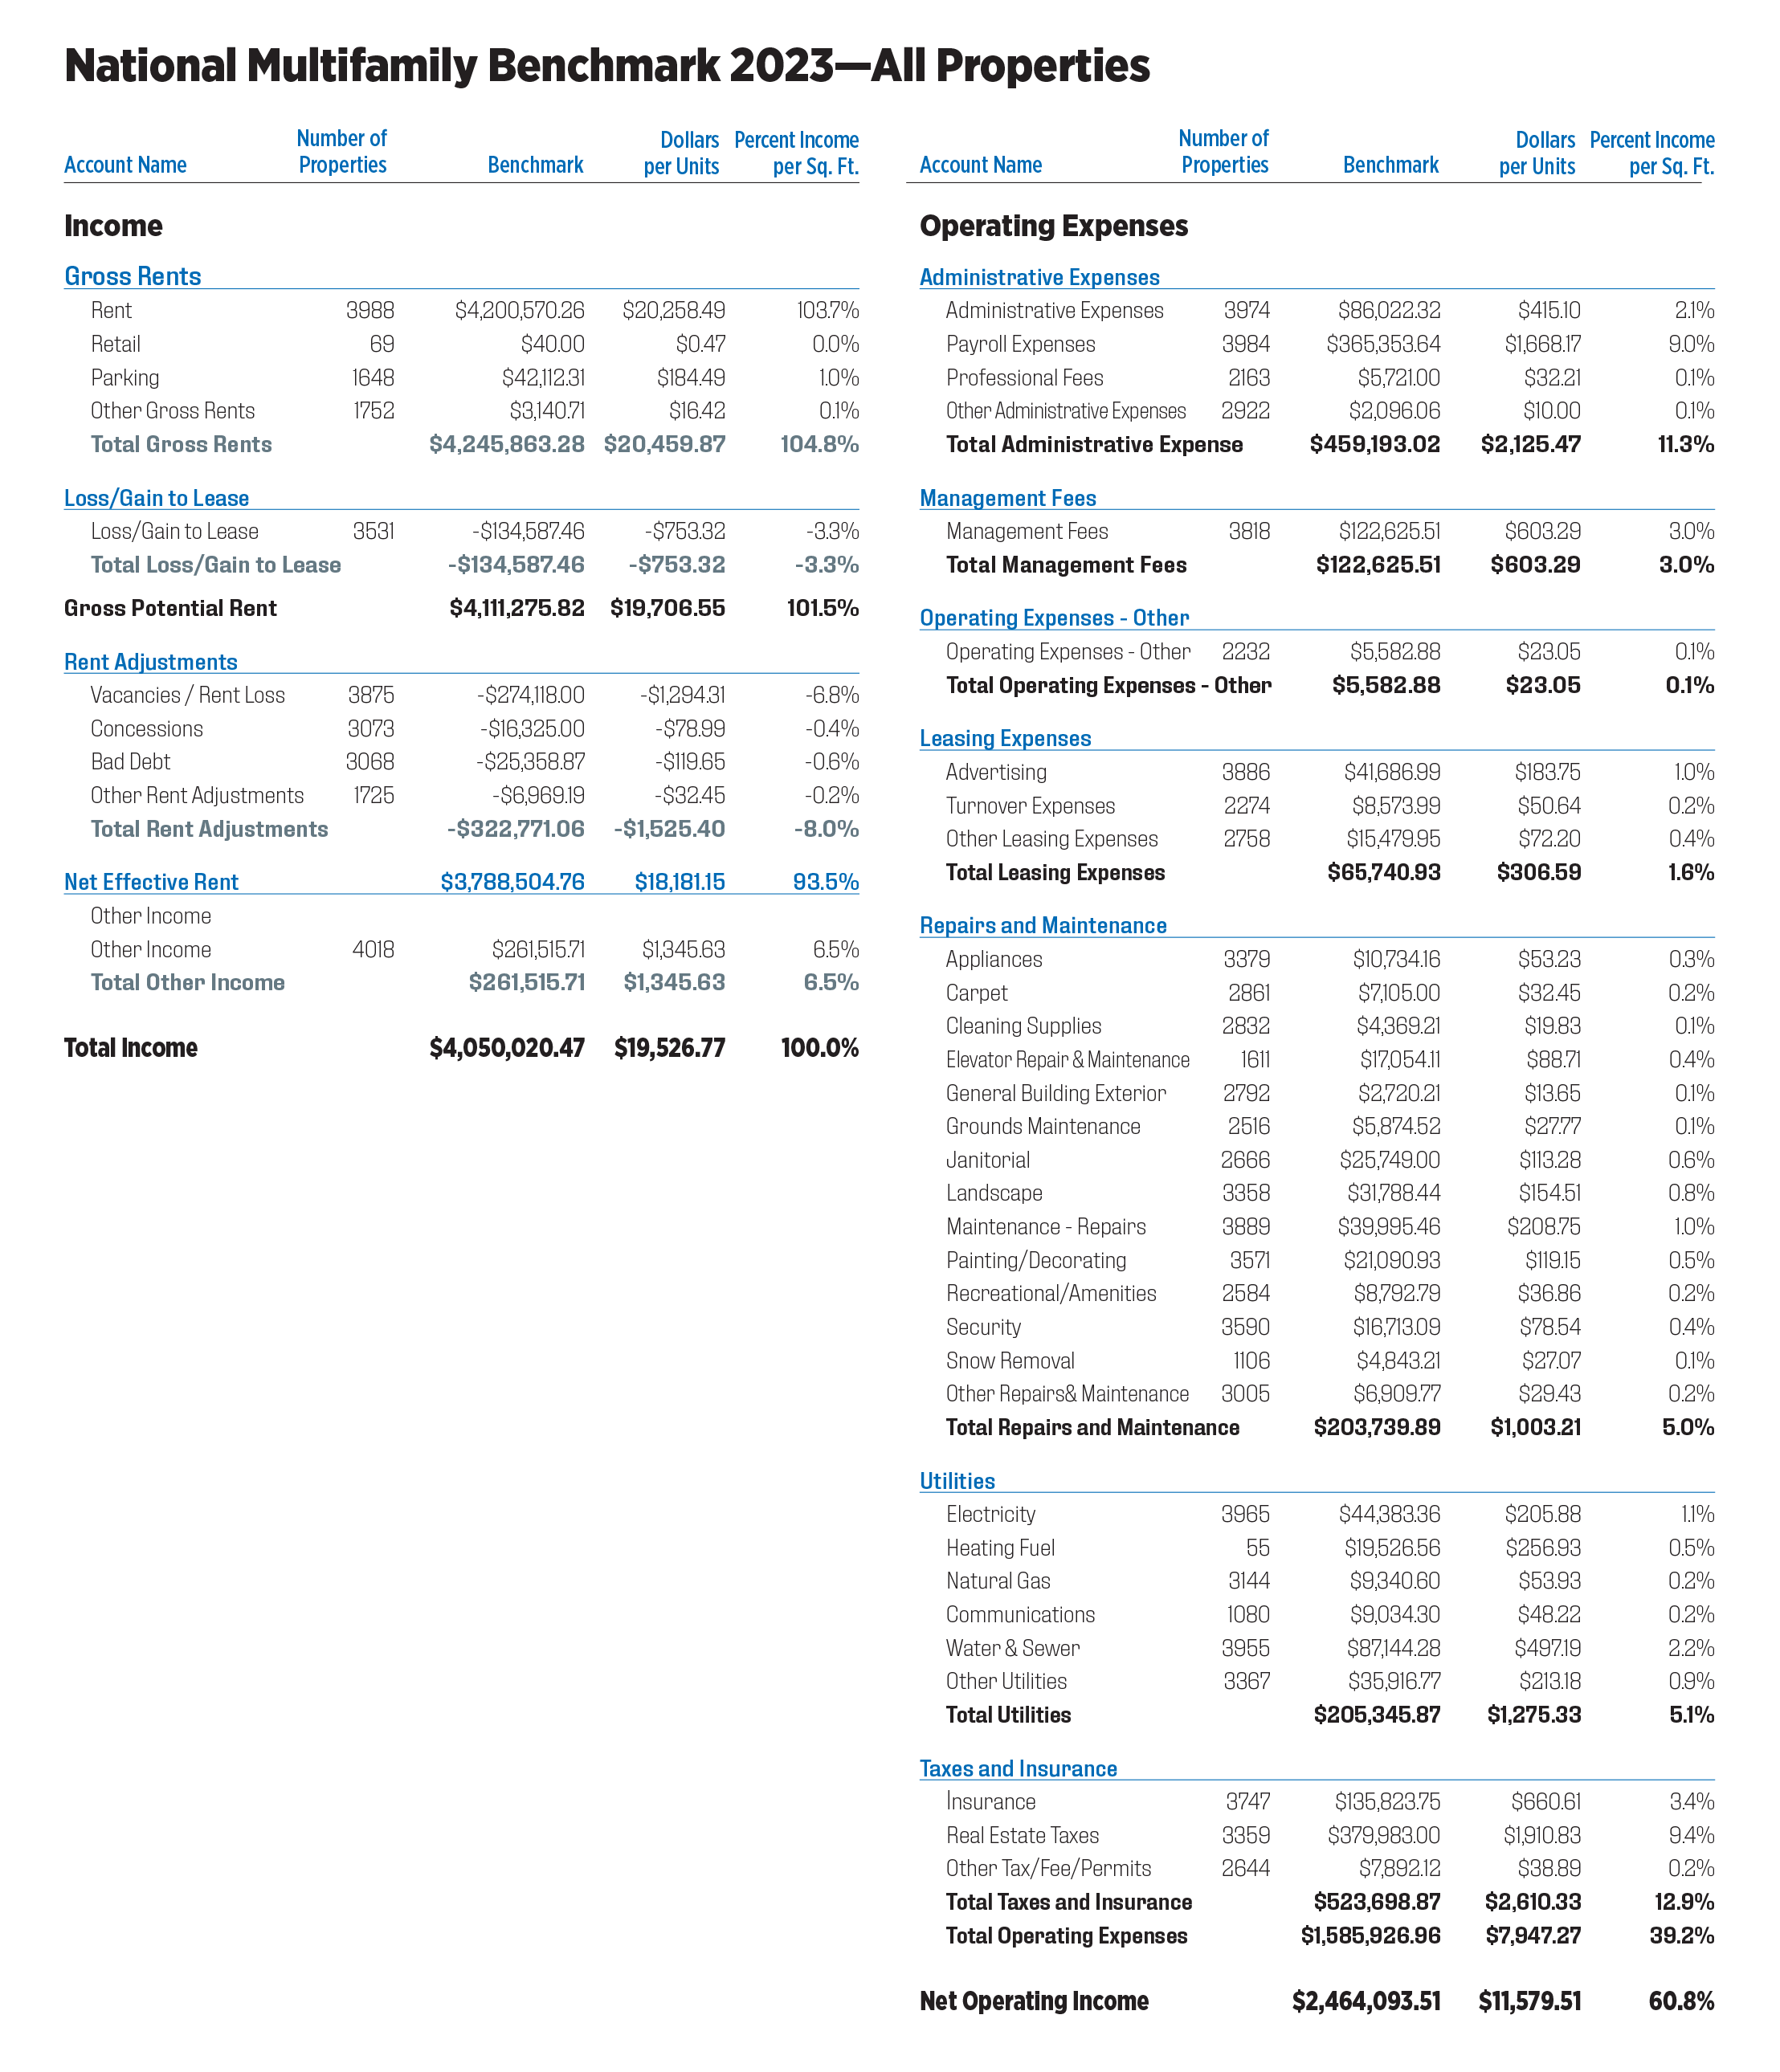
Rent growth averaged 3.6%, a sharp deceleration from 2022. Moderate rent growth and elevated renewal rates led to loss-to-lease improvements, but those were more than offset by increases in bad debt, concessions and vacancy loss. Bad debt increased 39% from the prior year, while concessions more than doubled from a low of just $26 per unit in 2022. Revenue from parking fees increased modestly by 2.5%, while the other income category posted a solid 8.3% gain.
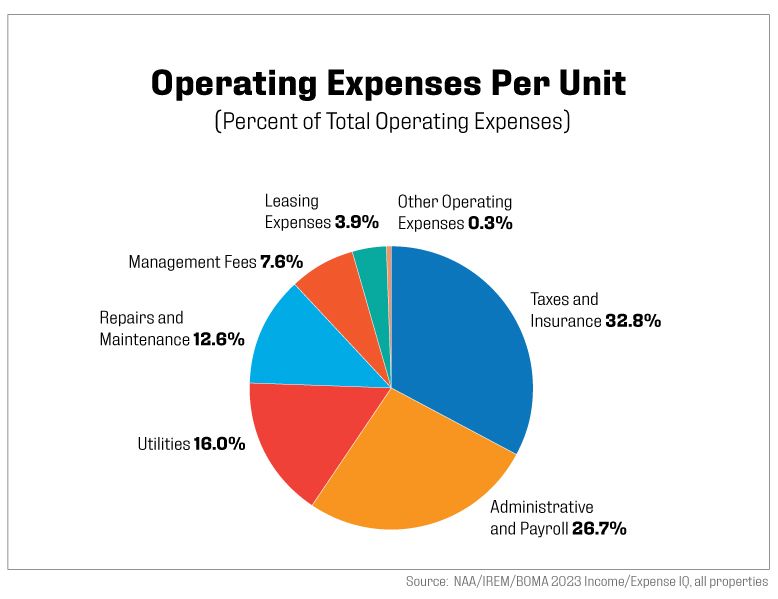
With the exception of utilities, which experienced a modest increase of 1.4%, expense growth across all categories far-outpaced rent growth. Although insurance costs comprised about 8% of expenses, they experienced an outsized increase of 26.2% in 2023, more than double the increase in 2022. Natural disasters are leading to higher insurance costs in coastal areas, but no region of the country was immune from skyrocketing costs. High insurance costs are having ripple effects across the industry, impacting financing activities as lenders become increasingly risk averse.
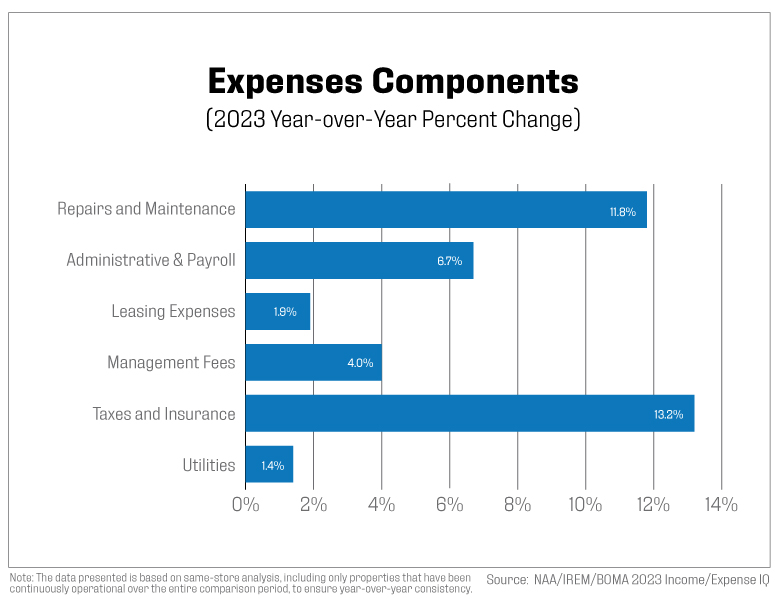
Repairs and maintenance costs rose 11.8%, slightly lower than last year, driven by increases in painting/decorating, janitorial services, elevator repairs and security. This fits squarely with Consumer Price Index figures, showing inflation for services averaging 6.2% in 2023, while prices for goods (excluding food) decreased by an average of 1.4%.
Administrative costs were up 11.7%, while payroll expense increases also remained elevated at 5.6%. Nationally, payroll costs were up 4.4% in 2023, according to the Bureau of Labor Statistics’ Employee Cost Index, which includes not only salaries and wages but the costs of benefits and bonus pay. NAA expects to see a deceleration in personnel cost growth in 2024, given the cooling of the labor market with a slowdown in job openings, hirings and quit rates, pointing to a market that is now favoring employers.
Property taxes, which comprised 26.3% of operating expenses, increased 9.7% in 2023, up from 5.3% the prior year. More than one-third of the markets included in this analysis experienced double-digit increases in property taxes. Orlando, Fla.; San Diego, Orange County, Calif.; Los Angeles; and Chicago saw increases ranging from 17% to 50%.
Other expenses such as management fees moderated, increasing 4.0% after posting a double-digit increase last year. Utility costs also moderated, up 1.4% following an 18% increase in 2022, the year of 40-year highs in inflation across the U.S. Increases in water/sewer expenses were nearly offset by decreases in heating fuel and natural gas.
Metropolitan Area Overview
The 2023 Income/Expense IQ provides apartment benchmark data for 110 metropolitan areas. This section of the national summary focuses on benchmarking same-store data and analysis in the metro areas, each containing at least 20 multifamily properties, with about 26% of the total metro areas available in 2023 falling in this category. The year-over-year breakdown, along with the cumulative trend analysis from 2021 to 2023 for key financial metrics – revenue, operating expenses and net operating income – across the top metro areas will be discussed in this section.
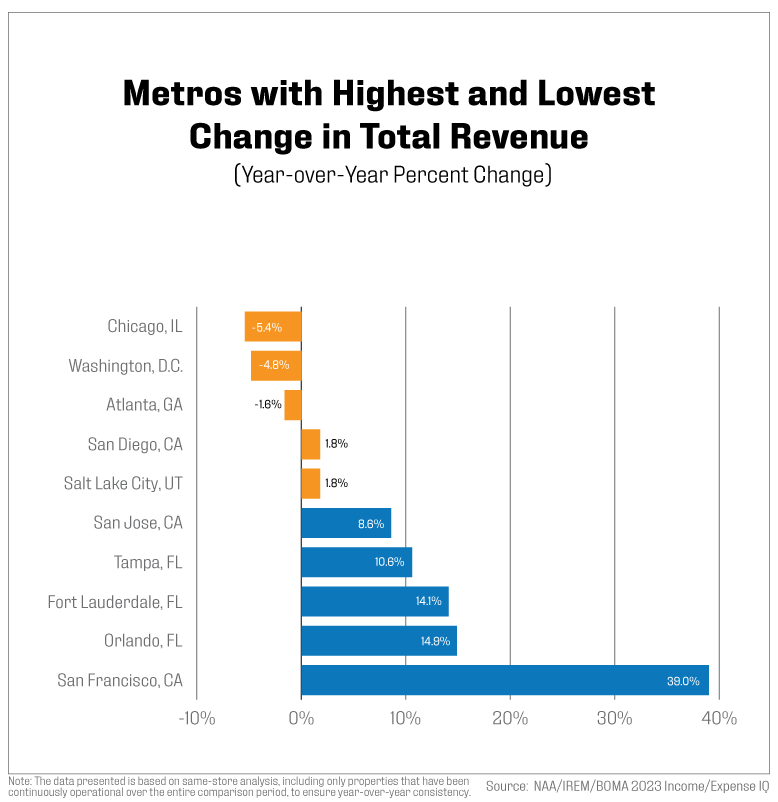
Revenue growth in San Francisco was exceptionally high, partly because of a lower base in the prior year as pandemic shocks lingered. As recovery took hold, San Francisco led year-over-year revenue growth with a 39% increase, driven largely by rising rental prices, supplemented by gains in retail revenues and parking fees. Orlando followed with a 14.9% increase, and Fort Lauderdale, Fla., saw a 14.1% rise. Conversely, the markets experiencing the steepest declines in annual revenue growth included Atlanta, which decreased by 1.6%, Washington, D.C., declining by 4.8%, and Chicago, which faced a decline of 5.4%. Atlanta’s revenue downturn was primarily driven by high levels of apartment construction, resulting in an oversupply of units, higher vacancy rates and downward pressure on rents. While Washington, D.C., was affected by elevated vacancies and lease losses, Atlanta also faced significant increases in concessions and bad debt, further contributing to its revenue decline.
In a broader analysis, Minneapolis was the only market that reported cumulative negative growth in total revenue from 2021 to 2023, showing a slight decline of 0.8%. The markets with the lowest, yet positive, cumulative revenue growth were Jacksonville, Fla. (0.4%), Chicago (4.7%), Orange County (5.6%) and Oakland, Calif. (8.6%). In contrast, the metro with the most significant cumulative increases were recorded as follows: 50.3% for Orlando; 28.1% for Norfolk, Va.; 26.3% for Tampa, Fla.; 24.8% for Salt Lake City; and 24.6% for Dallas.
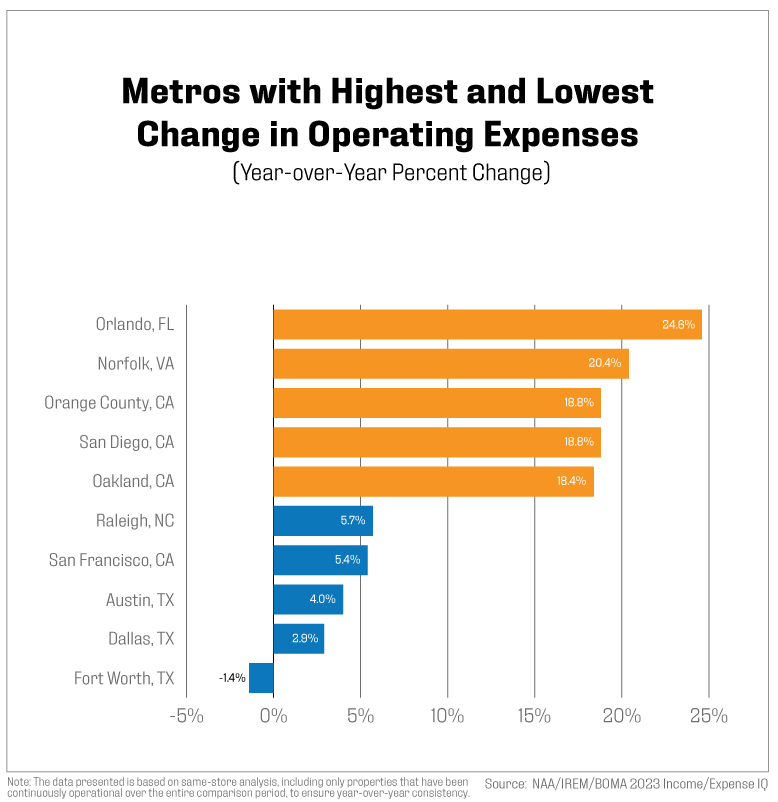
Operating expenses per unit varied considerably across markets, ranging from $5,902 in Jacksonville to $18,485 in San Francisco. About 97% of the 29 metro markets analyzed experienced year-over-year increases in operating expenses. Growth rates in expenses ranged from 2.9% in Dallas to 24.6% in Orlando. The markets with the highest annual growth in operating expenses were Orlando at 24.6%, Norfolk at 20.4%, Orange County at 18.8%, San Diego at 18.8% and Oakland at 18.4%. On the other hand, Raleigh, N.C., San Francisco, Austin, Texas, and Dallas experienced the smallest increases in operating expenses, while Fort Worth, Texas, was the only market to report a decline, with a negative growth rate of 1.4%.
All analyzed markets had a positive cumulative growth in operating expenses from 2021-2023, with the largest increases observed in Orlando (49.8%), San Diego (34.2%), Norfolk (31.0%), Los Angeles (26.9%) and Fort Lauderdale (26.7%). These increases were primarily driven by rising utility costs across metro areas, though the specific type of utility varied by location. San Diego and Norfolk, for instance, saw significant increases in electricity, natural gas, and water and sewer costs, while Orlando’s rise was mostly attributable to water and sewer expenses. In Los Angeles, natural gas prices were the main driver of the increase, along with a rise in leasing expenses. In most other markets, excluding Los Angeles, the increases were fueled by rising costs associated with insurance, maintenance and repairs, as well as painting and decorating.
While no market experienced a decline in cumulative operating expenses, Seattle (5.2%), and Chicago (0.9%), had the lowest cumulative growth.
Net Operating Income (NOI) in 2023 ranged widely, from $2,558 per unit in Minneapolis to $38,776 per unit in San Francisco. The markets with the strongest year-over-year increases in net operating income were recorded in San Francisco (63.9%), Fort Worth (16.6%), Fort Lauderdale (14.3%), Dallas (12.1%) and Tampa (10.3%). Conversely, the steepest declines occurred in Minneapolis (-18.2%), Chicago (-12.9%), Norfolk (-12.1%), Washington, D.C. (-10.6%) and Jacksonville (-7.4%).
In terms of cumulative changes over the three-year period, the highest growth in NOI was seen in Orlando, Dallas, Seattle, Salt Lake City and Fort Worth, with increases ranging from 27% in Fort Worth to 50.6% in Orlando. However, four markets reported negative cumulative NOI growth: Orange County (-0.4%), Oakland (-3.4%), Jacksonville (-5.9%) and Minneapolis (-43%).
Overall, 58.6% of the markets analyzed showed positive year-over-year NOI growth, while 86.2% showed a positive cumulative growth from 2021 to 2023. This suggests that most markets are experiencing sustained long-term improvements in operational efficiency despite short-term fluctuations.
Outlook
With recession chances looking increasingly unlikely as of October 2024 and the Fed beginning its rate-cutting cycle, apartment market conditions are poised for further improvements heading into 2025. Although the job market has cooled, steady job growth, strong wage growth and favorable demographics will continue to drive demand for rental housing. Markets with supply overhang will not see vast improvements in rent growth in the near term unless absorption picks up considerably; however, a shrinking construction pipeline may see rents turning sooner than expected. And while some expenses are beginning to at least level off, according to anecdotal information, operational efficiencies will remain top of mind for the foreseeable future.
View More Information on the Income/Expense IQ
About the Income/Expense IQ
NAA, IREM and BOMA have partnered with Lobby CRE to provide comprehensive income and expenses benchmarking data for the apartment sector in a simplified digital format. Data for the 2023 Income/Expense IQ was reported to have multifamily benchmarks for 4,027 conventional properties containing 904,724 units. Benchmarks are based on 2023 operating data provided by NAA and IREM members and other real estate practitioners. Currently, there are multifamily benchmarks available for 110 U.S. metro markets. The benchmark data is presented in three forms: Total dollar amount, dollars per unit and dollars per unit as a percentage of income.
Income/Expense IQ features and benefits include:
In-platform comparisons
Configure your property’s T12s in monthly, quarterly, annual or custom-defined periods and compare them to a benchmark in real-time.
Filtering
Tailor your filters to ensure the benchmark, and its results, accurately reflect your property’s attributes.
Collaboration
Get your team on the case by inviting team members to the platform to collaborate, share data insights and spot areas where you can improve.
Live benchmarks
Income/Expense IQ technology recalculates benchmarks monthly to ensure newly added property data is captured. This allows you to unlock more granular benchmark configurations as the data pool increases.
Automated submission
With the new Income/Expense IQ tool, you can securely submit data to gain access to additional platform features. And submitting data doesn’t require manual spreadsheets and emailed data. Schedule reports from property management software (PMS) to upload automatically to the platform.
Glossary of Terms
Administrative. Total monies spent on general and administrative items such as mileage reimbursement, bank charges, legal/eviction charges, postage, office supplies, uniforms, credit reports, permits, membership dues, subscriptions, data processing, etc. Does not include any payroll-related expenses.
Other Administrative Expenses. Any administrative expenses that cannot be attributed to the included list of administrative expense line items.
Communications. Total monies spent on communication utilities such as telephone, internet and wireless services.
Contract Services/Professional Fees. Payments to vendors for services rendered. Trash services should be included under “other utilities.”
Gross Potential Rent. Total rents of all occupied units as at year of submission lease rates and all vacant units as at year of submission market rents (or fiscal year end).
Heating/Cooling Fuel. Type of fuel used in apartment units.
Insurance. Includes property hazard and liability and real property insurance and does not include health/payroll insurance.
Leasing Expenses. Includes marketing/advertising, turnover expenses and other leasing expenses.
Other Leasing Expenses. Any leasing expenses that cannot be attributed to the included list of leasing expense line items
Loss/Gain to Lease. Difference between actual contract rents and market rental rates.
Management Fees. Total fees paid to the management agent/company by the owner.
Marketing/Advertising. Includes all marketing and advertising expenses for the property.
Net Commercial Square Footage. Total rentable square feet of commercial floor space.
Net Rentable Residential Square Feet. Total rentable square feet of floor space in residential units only. Area reported includes only finished space inside four perimeter walls of each unit. Common areas are excluded.
Payroll Expenses. Gross salaries and wages paid to employees assigned to the property in all departments. Includes payroll taxes, group health/life/disability insurance, 401(k), bonuses, leasing commissions, value of employee apartment allowance, workers’ compensation, retirement contributions, overtime and other cash benefits.
Rental Revenue Commercial/Other. Total rent collections for any commercial space after vacancy/administrative, bad debt and discount or concession losses.
Rental Revenue Residential. Total rent collections for residential units.
Other Rent Adjustments. Any rent adjustments that cannot be attributed to vacancy, concessions or bad debt.
Total Repairs and Maintenance. Total monies spent on general maintenance, maintenance supplies and uniforms, minor painting/carpeting repairs, plumbing supplies and repairs, security gate repairs, keys/locks, minor roof/window repairs, HVAC repairs, cleaning supplies, etc. Does not include any payroll-related expenses or non-recurring capital expenses. Contract services are reported separately: appliances; carpet; cleaning supplies; elevator repair and maintenance; general building exterior; grounds maintenance; janitorial; landscape; painting/decorating; maintenance – repairs; recreational/amenities; security; snow removal; other repairs and maintenance.
Total Utilities. Total monies spent on electricity, natural gas, communications, water & sewer, and other utilities.
Other Revenue/Income. Monies received, including amenity fees, parking fees, laundry, pet fees, storage and “other”). All “other” would include the sum of any items not specifically listed above (e.g., vending, deposit forfeitures, furniture, late fees, termination fees, application fees, etc.). NOTE: Interest income or utility reimbursements are not included. (Utility reimbursement/recovery is subtracted from gross utility costs.)
Revenue Losses/Adjustments to Collections/Bad Debt. Total amount of residential rents not received due to collection losses.
Revenue Losses/Adjustments to Concessions. Amounts of gross potential residential rents not received due to concessions.
Revenue Losses/Adjustments to Vacancies. Amount of rental income for residential units not collected because of vacancies and/or other uses of units, such as models and offices.
Taxes. Total real estate and personal property taxes only. Does not include payroll or rendering fees related to property taxes or income taxes.
Other Taxes, Fees, Permits. Any permit costs, fees or taxes, outside of property tax. Does not include payroll taxes.
Total Operating Expenses. Summation of all operating costs. The sum of all expense categories must balance with this line, using total net utility expenses only. Does not include debt service or any one-time extraordinary costs or capital costs.
Paula Munger is NAA’s Vice President, Research.
Erioreoluwa “Eri” Bajomo is NAA’s Industry Research Analyst.