
Although cities experienced a resurgence of population and apartment demand growth immediately following the recession, suburbs have regained popularity according to migration, occupancy and rent growth trends.
For years, we’ve heard about the mass movement of both businesses and individuals from the suburbs to the city, but recent exclamations of “The suburbs aren’t dead!” warrant a closer look into what the data have to say. First, the terminology and definitions are far from precise: city, urban, urban core, city center, non-core, edge, suburban, and many more that have yet to make it into the dictionary.
While it’s hard to refute a city’s characteristics, especially when population counts are tied to them, suburbs are becoming more and more difficult to recognize. Cul de sacs, driveways, backyards and single-family homes are what comes to mind, and those certainly remain prevalent. But suburbs around the country are getting a facelift – and they’re benefitting by way of more residents, jobs and commerce.
Unfortunately, there’s no real government definition of a suburb, and the U.S. Census Bureau derives its suburban population figures basically through the process of elimination. Census uses the Office of Management and Budget’s definition of a principal city, which is roughly defined as the largest city in a Metropolitan Statistical Area (MSA), although those areas can have more than one principal city based on population and employment criteria. That means anyone living in an MSA, but not a principal city, is put into the suburban bucket although they might live within the boundaries of a major metro area. With those limitations in mind, on to the analysis.
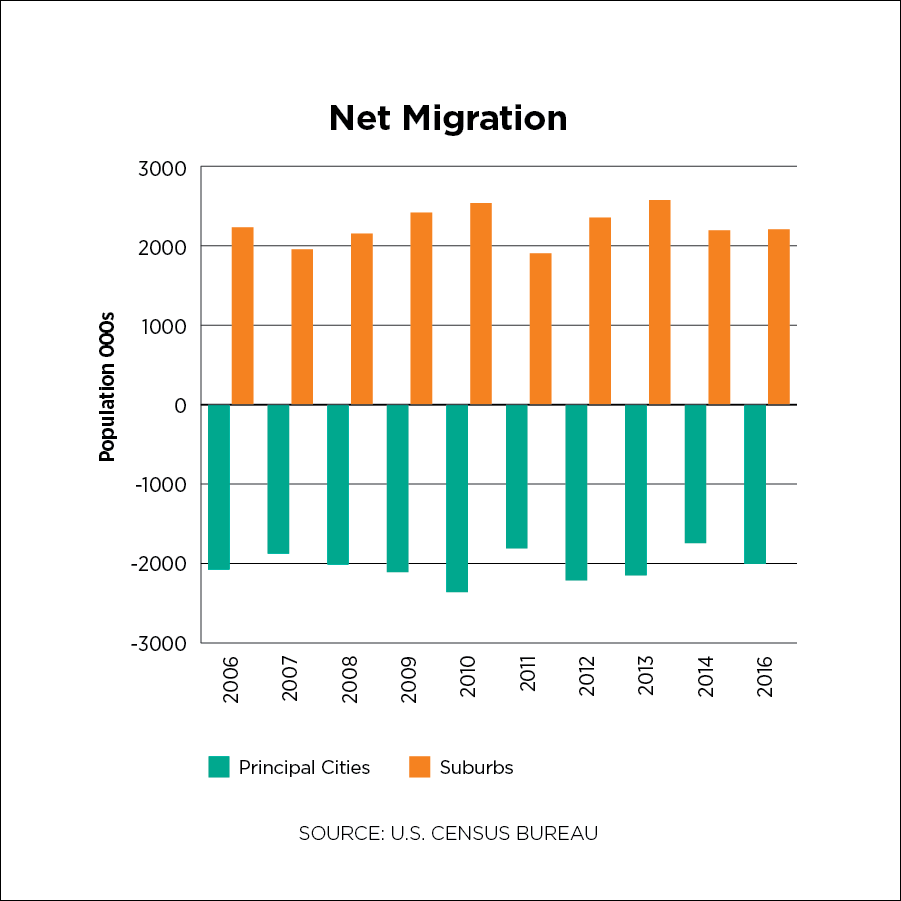
The urbanization of areas outside the core, through the addition of amenities, public transit links, and mixed-use spaces, are making them more attractive as the net migration figures show, that is, the number of people moving in minus the number of people moving out. From 2006 through 2016, net migration to the suburbs averaged 2.2 million persons per year, while principal cities lost an average of 2 million people per year.
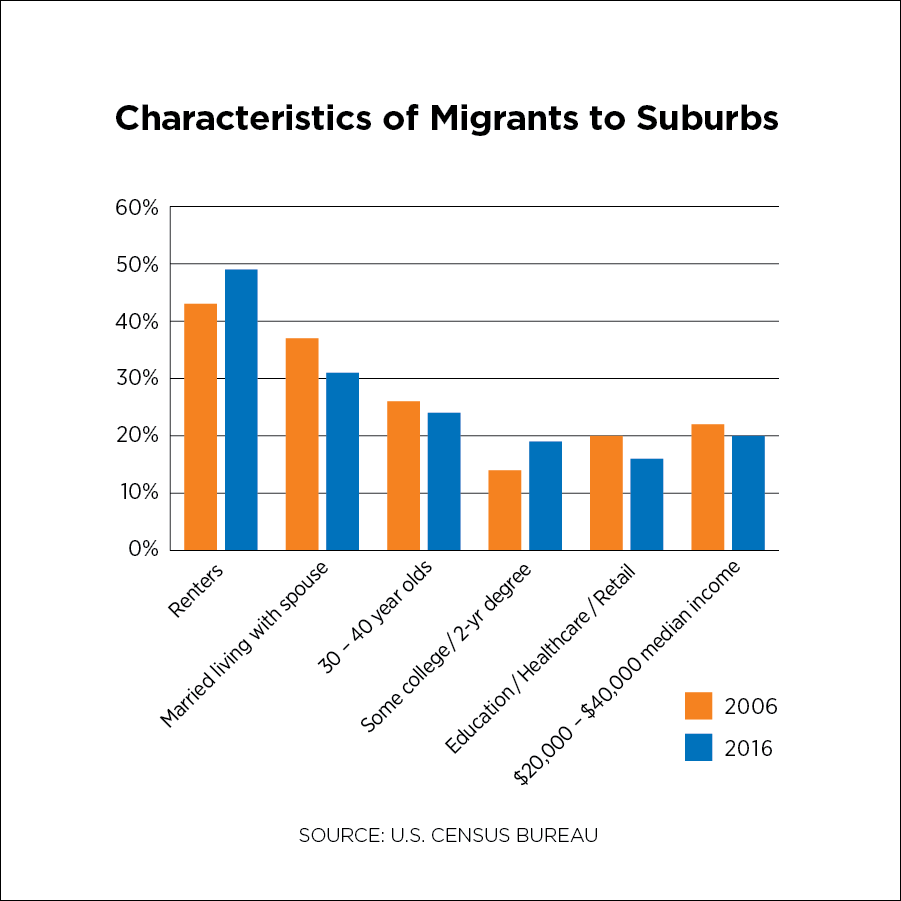
What do recent movers to these “outlying” areas look like? In 2016, about 49 percent were renters, up from 43 percent in 2006, 31 percent were married with a spouse present, and nearly a quarter were in the 30-44-year-old age group, the largest age cohort. Nineteen percent had some college or a two-year degree, and equal numbers of them worked in the education/healthcare fields as did the retail/wholesale trade sectors. With 2015 median incomes largely falling in the $20,000-$40,000 range, affordability was clearly a key driver in their moves.
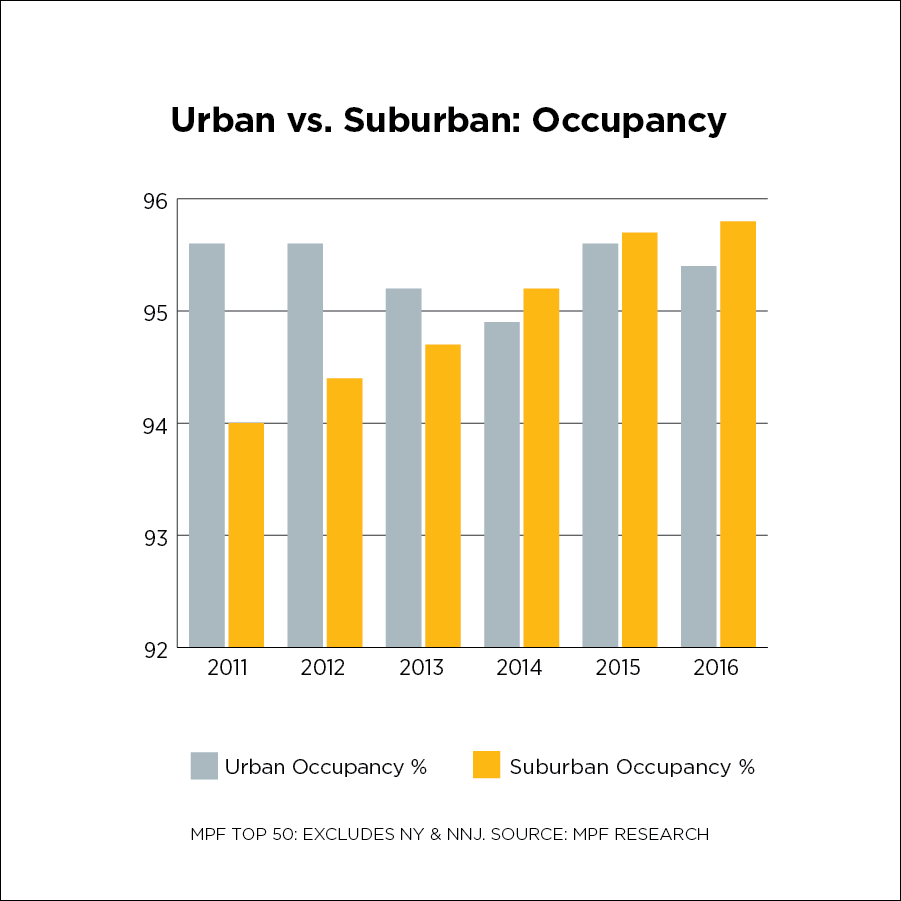
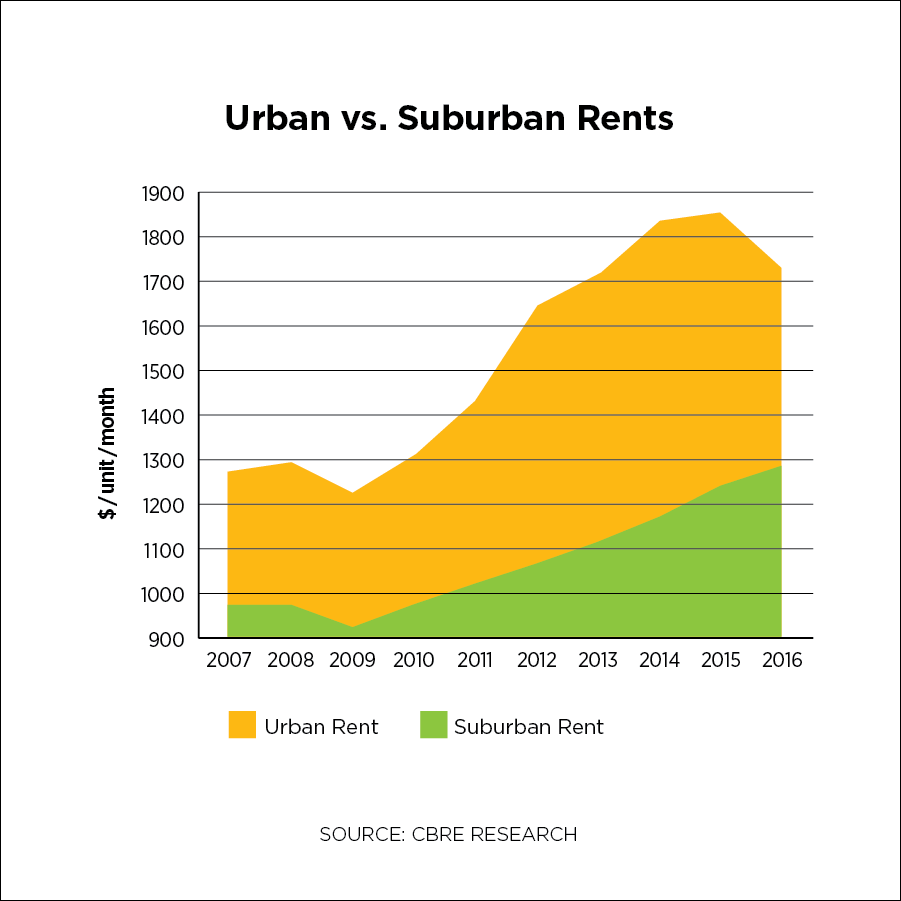
Given the demand, more affordable options and increased conveniences in the suburbs, it should come as no surprise that suburban apartment markets have been outperforming their urban counterparts, according to data provided by both MPF Research and CBRE. The turning point for the suburbs was 2013/2014 when rent growth and occupancies began outpacing growth in urban areas, a trend which continues today.
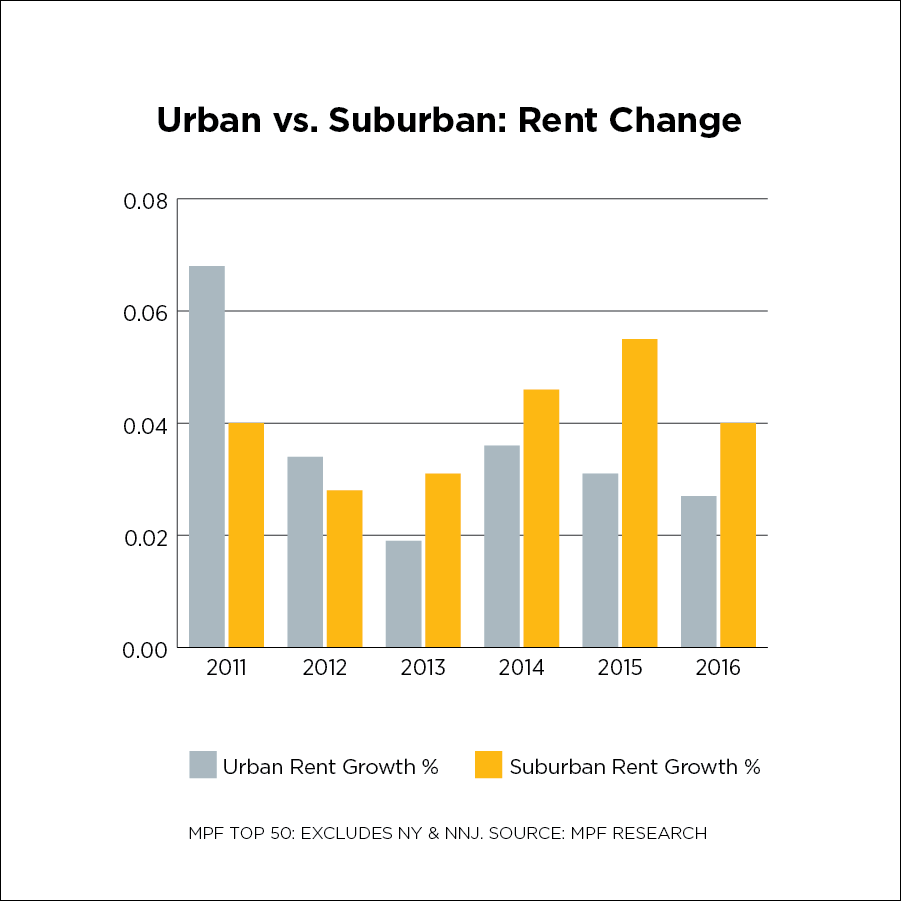
While rents are growing in both urban and suburban markets, urban apartment renters pay a 35 percent premium to live in the center of it all. The gap has narrowed by more than $200 per unit since 2014 when urban rents cost $659 more. The influx of new supply in urban cores has hampered rent growth there, while demand for more affordable options in the suburbs has pushed up rents in those areas, some of which are flush with amenities and vibrancy. With more new supply coming to center cities, and vacancy rates flirting with four percent in the suburbs, expect the gap to narrow further in 2017.
Even as rents increase for suburban residents, they will still have several hundred more dollars in their pockets every month, a powerful draw ensuring the survival of the suburbs – no matter how they’re defined.