How has apartment affordability changed since Q2 2021?
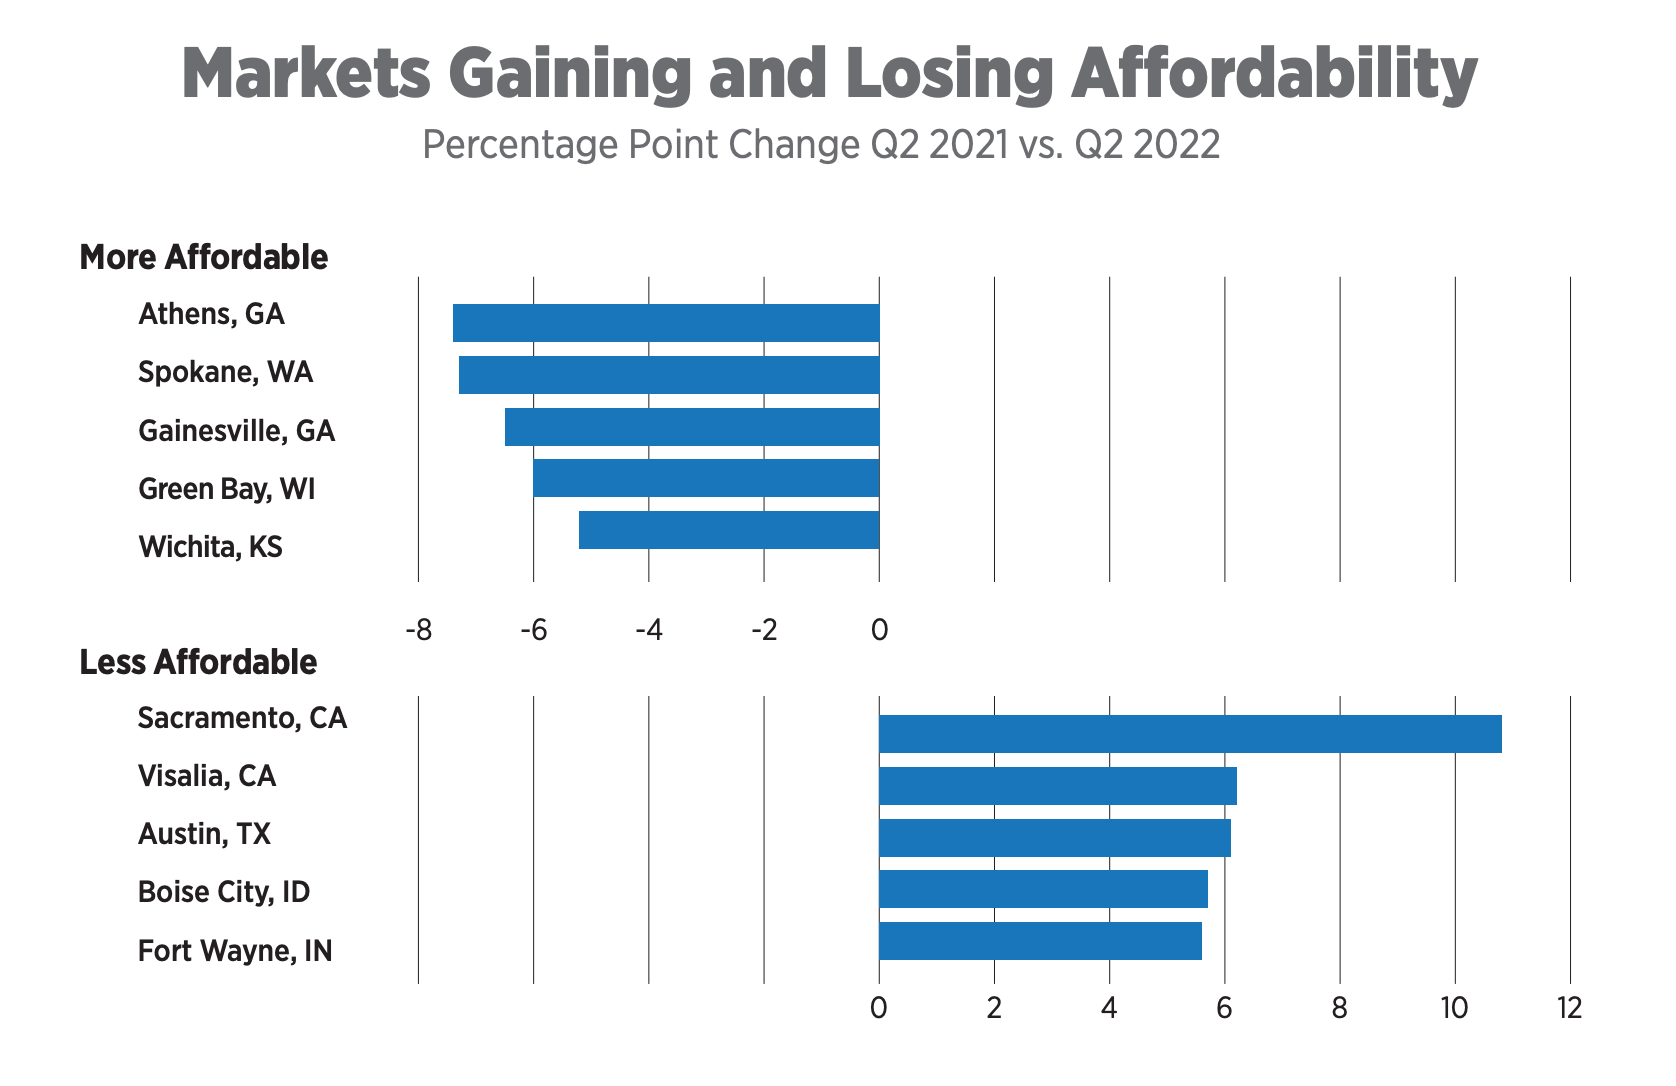
The Athens market has seen a significant gap between income growth and rent increases. Renters’ incomes increased nearly 20% since Q2 2021 while rent only went up 9.1%. According to the U.S. Bureau of Labor Statistics (BLS), government, leisure and hospitality and professional and business services industries had the highest job growth in June. Affordability in this college town is nothing new; Athens is consistently ranked as a top market for retirement due to the low cost of living.
The apartment market in Sacramento has been on an upward trajectory for quite some time due to a healthy job market, population growth and soaring home prices. CoStar reported that during the past decade, rents in Sacramento were up by an astounding 79%, with 3.8% coming from the past 12 months.

Where are apartments most and least affordable?
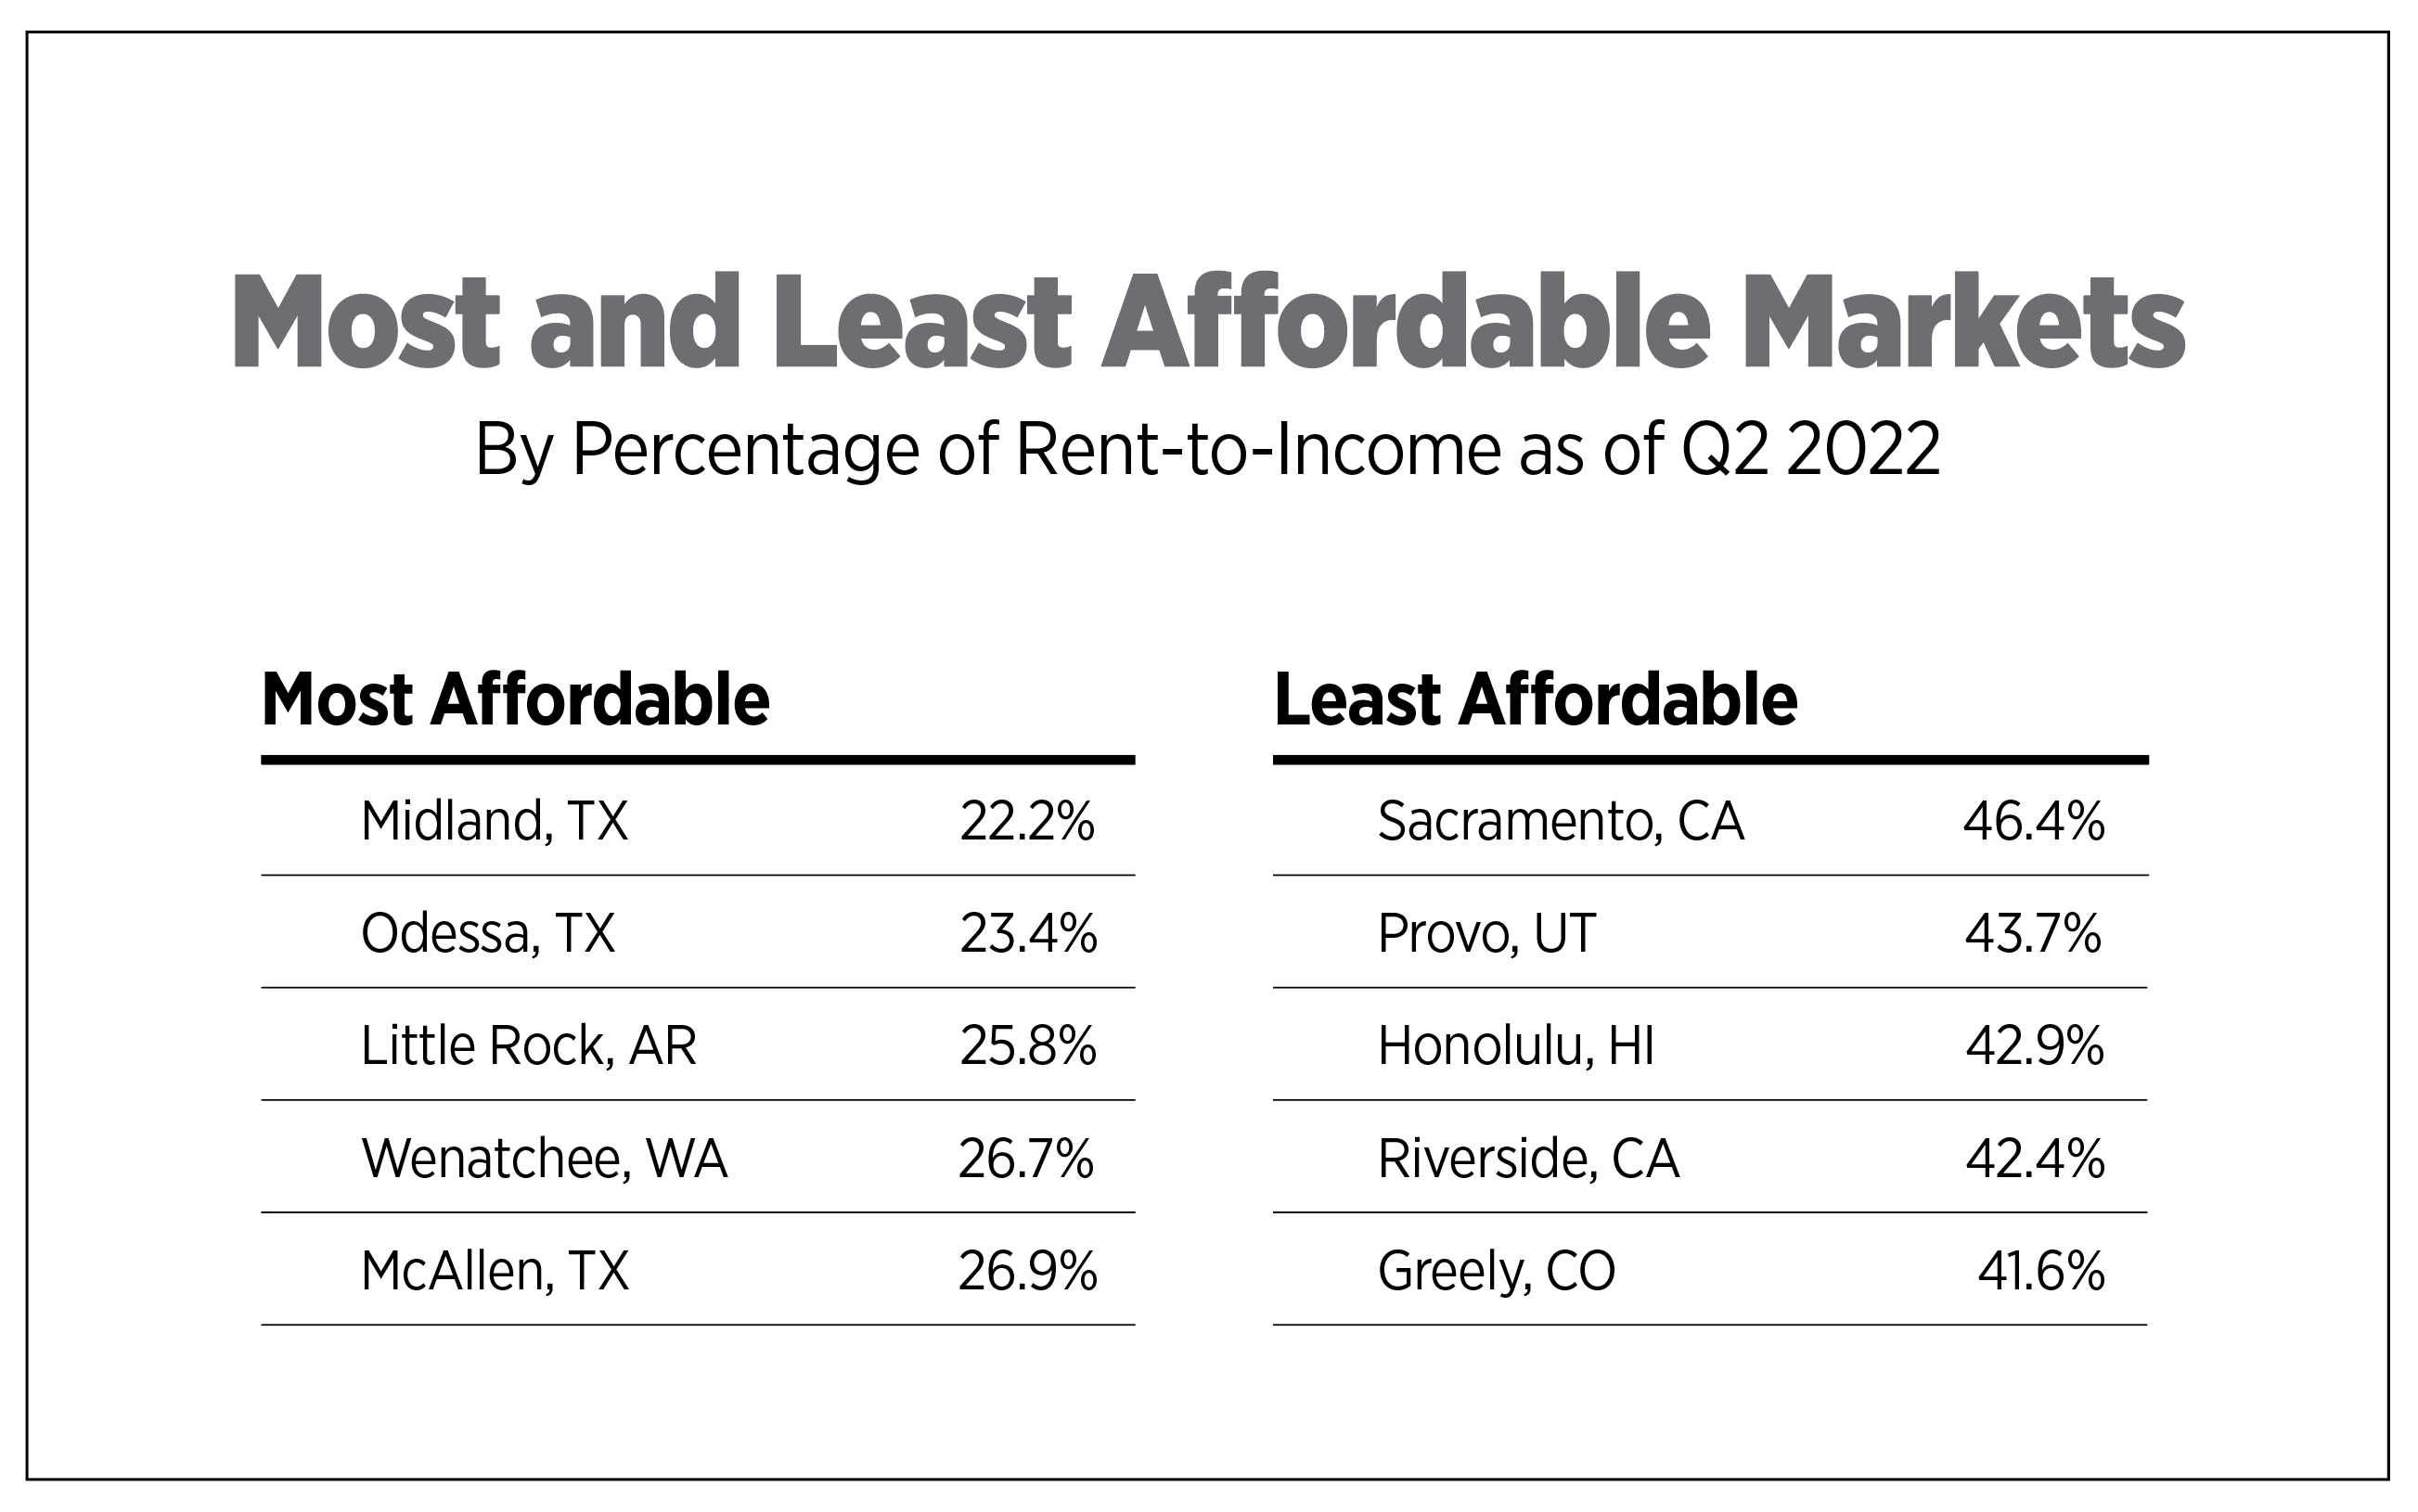
Midland, Odessa and Wenatchee ranked among the most affordable markets for a second consecutive quarter, while Little Rock and McAllen made their debut on the top five list. Little Rock has seen solid rent growth during 2022 as vacancy rates tightened due to demand from would-be homebuyers. The market remains affordable for renters even with rent growth that has tripled since 2019. According to CoStar data, effective rent growth reached 7.5% in Q2 2022, far surpassing the decade average of 1% to 2%.
In contrast, Western markets including Sacramento, Provo, Honolulu, Riverside and Greeley were the least affordable markets. The Honolulu apartment market has been booming due to an increase in demand along with low inventory. As a result, Oahu has been on a nine-quarter stretch of positive absorption. The high demand for rental housing is because of the high cost of living. Even though the median household income in Oahu is higher than the national average, it is not enough to make homeownership attainable for many people. Renters are also feeling the burden of high housing costs. Although rent growth has moderated since 2021, renters are paying nearly 43% of their income toward rent.

The quarterly Affordability Watch tracks rent-to-income percentages for over 100 metropolitan areas. Use the interactive map below to see apartment affordability trends for your local area.
Where is apartment affordability at highest and lowest risk?
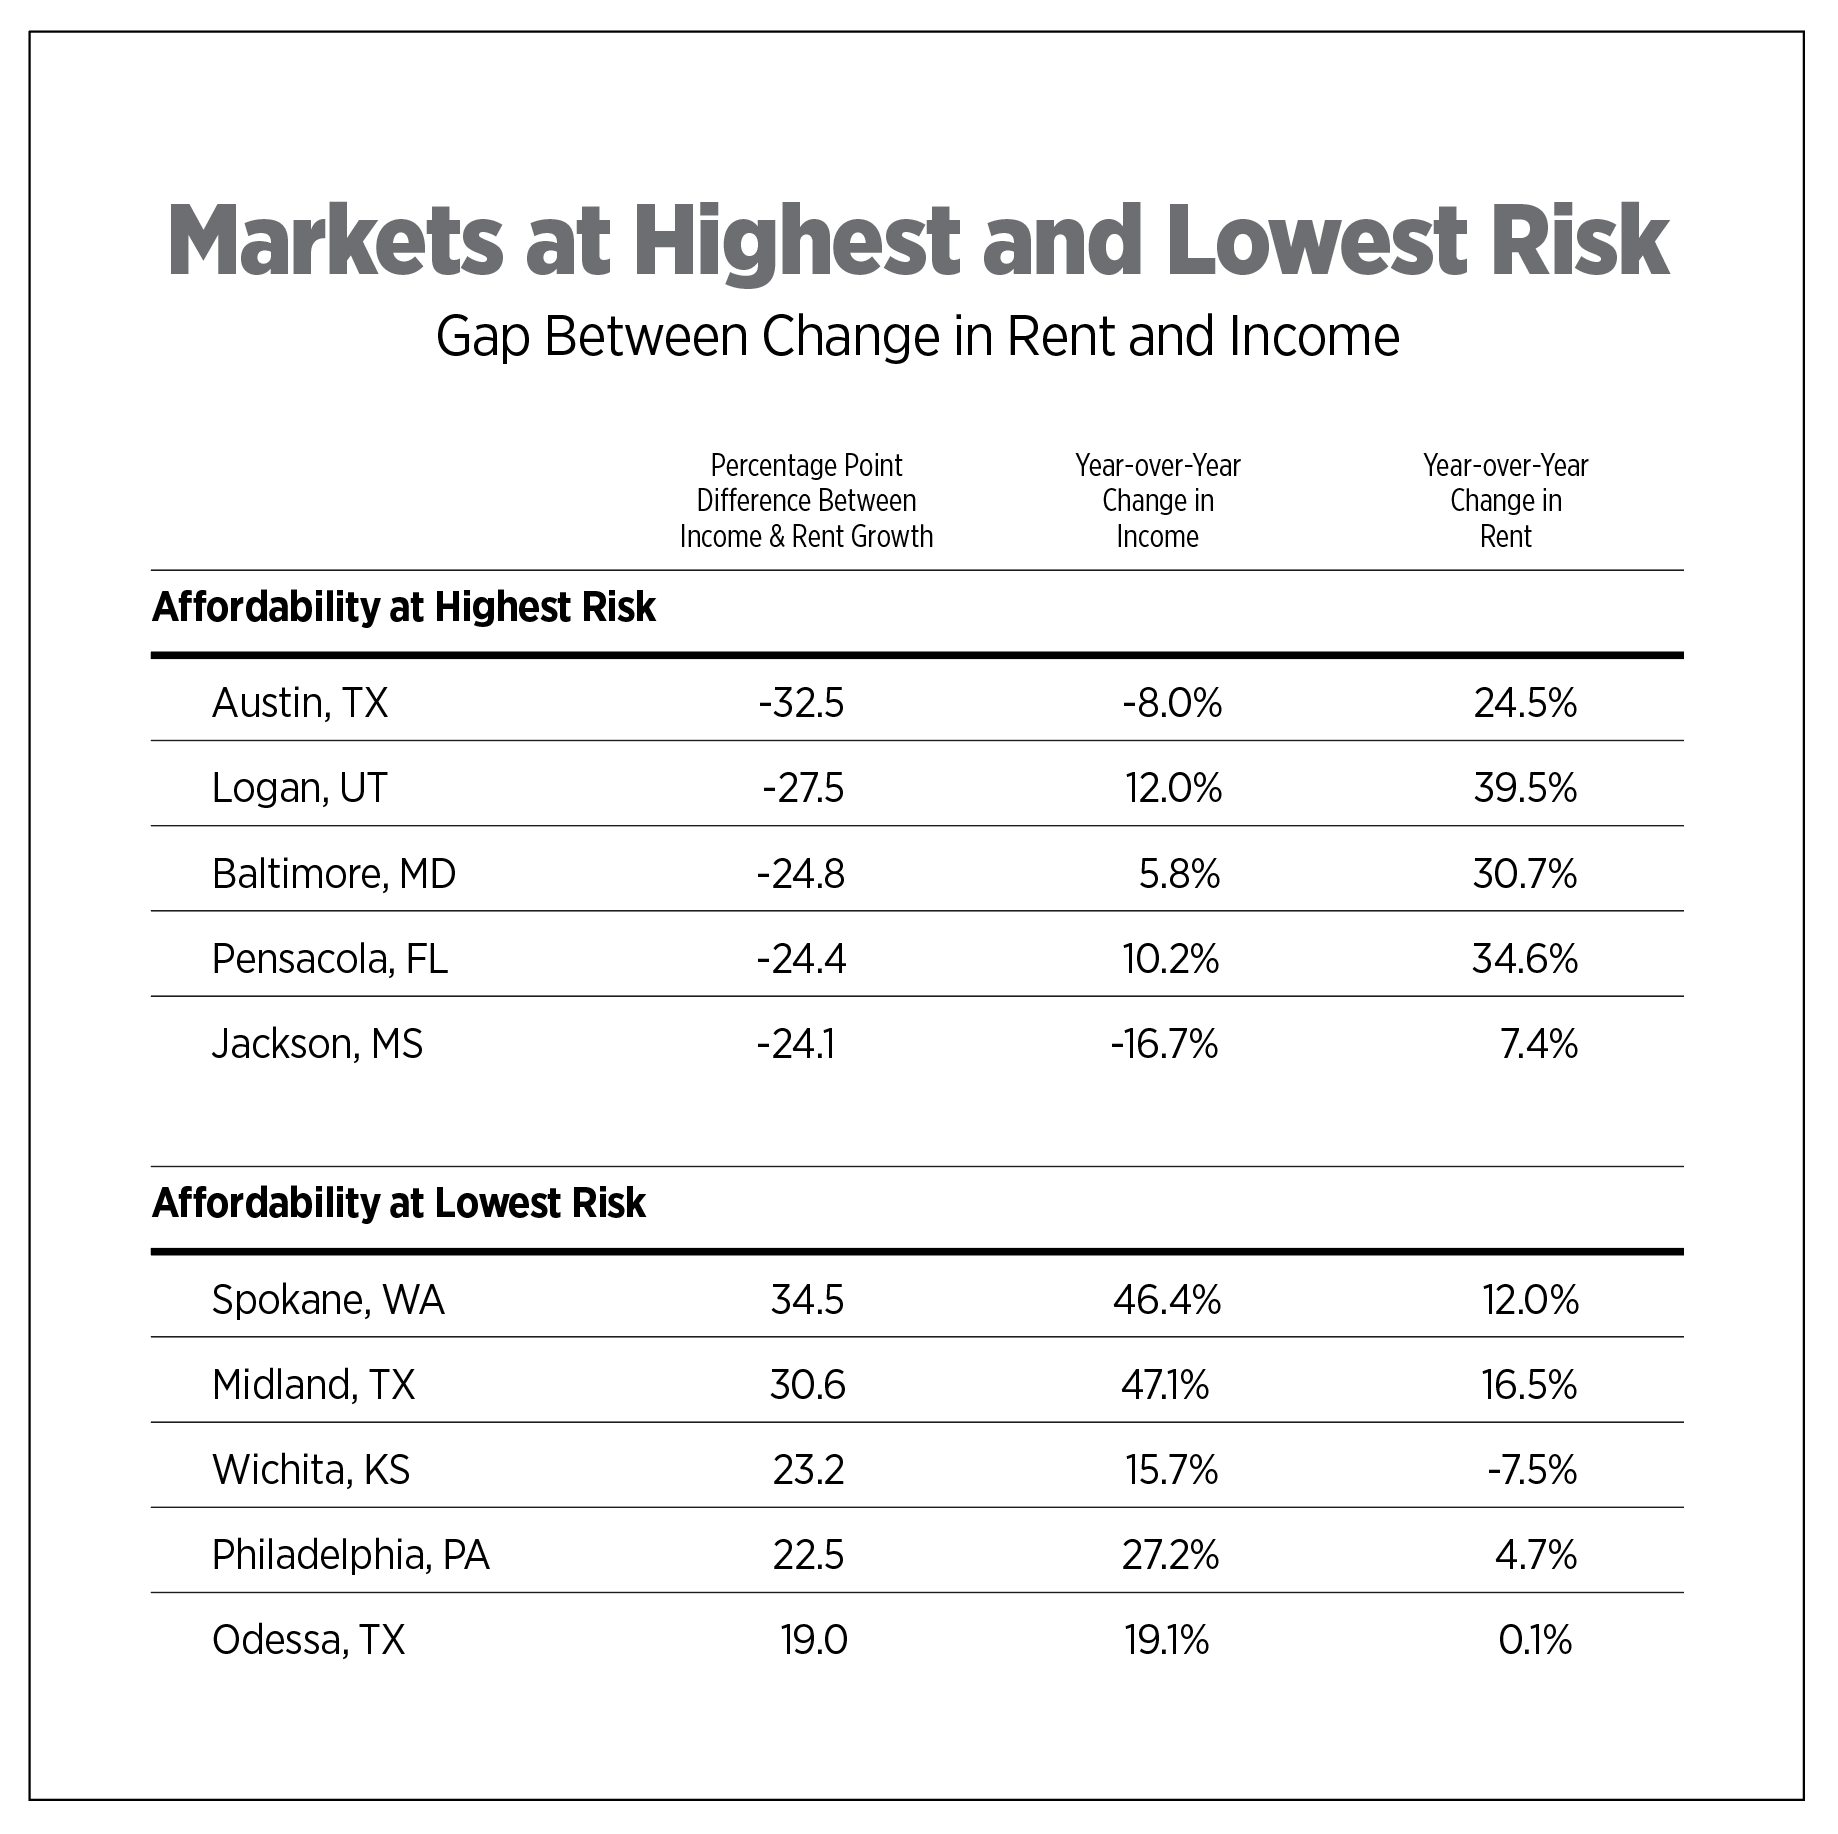
The Austin apartment market is one of the fastest recovering markets in the U.S., with a booming job market playing an important role in the city's economic growth. Historically, effective rent growth averaged 2.8% annually, but over the past 12 months, it’s shot up to 8.6%. Renters paid 38.6% of their income toward rent. According to new research from NMHC and NAA in partnership with Hoyt Advisory Services and Eigen10 Advisors LLC, Austin will be the leading market for apartment demand through 2035. The report indicates that 117,107 new apartment units are needed annually to keep up with increased demand.
The labor market in Spokane is in excellent condition. The many universities and colleges in the area yield a large talent pool of potential employees for a variety of businesses. The education and health services industry and the trade, transportation and utilities industry are the two largest job sectors for the market. In terms of apartments, rent growth in Spokane slowed after a period of elevated growth. Vacancy rates were up and may increase again because of new construction that is scheduled to come online soon. A strong labor market combined with muted rent growth puts apartment affordability in Spokane at low risk.

In Conclusion
Despite inflation and worries about a recession, demand for apartments remains strong but at subdued levels. The strong labor market continues to steadily increase demand but supply shortages remain a high concern. The U.S. needs to build 266,000 new apartment homes annually to keep up with apartment demand. Increased costs of construction, restrictive land use regulations and NIMBYism have created roadblocks for developers to build more apartments. Limited supply results in higher rents, and households that spend more of their income on rent are left with less money left over for other expenses. This creates a vicious cycle where renters are struggling to keep current with rent, especially when inflation and rising interest rates intensify financial stability risk.
Notes:
-
Rent-to-income averages are based on approved residential lease applicants screened by TransUnion’s ResidentScreening platform in Q2 2021 and Q2 2022.
-
Q2 2021 and Q2 2022 data covered 200,086 and 201,509 rental applications, respectively.
-
Market level analysis was conducted for 131 markets which received over 100 applications.

