
U.S. Apartment Market
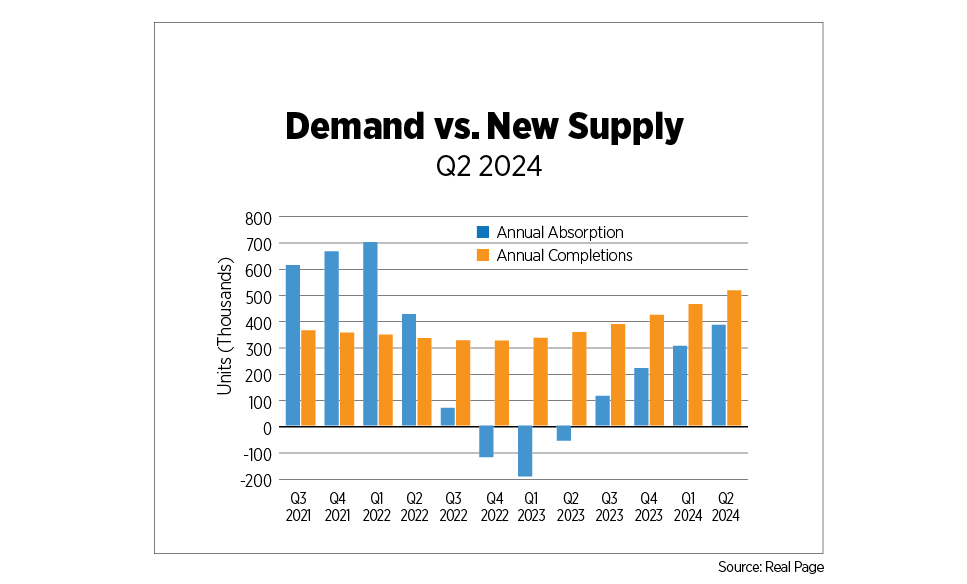
The year began with a remarkable increase in demand, which continued to climb through the second quarter, reaching one of its highest figures on record at about 390,000 units absorbed at an annual rate, according to RealPage. Although absorption fell short of the boom experienced during the pandemic recovery, specifically between Q2 2021 and Q2 2022, it exceeded its year-over-year figures over the past four quarters, with a total net increase of over 448,000 apartment units.
Simultaneously, the supply of new apartments has skyrocketed to over 500,000 units completed by the end of the second quarter, marking a 44.7% increase from the same time last year. However, this figure did not reach its peak of nearly 550,000 units seen in 1986. Despite supply still outpacing demand, the quarterly supply-demand gap from Q1 to Q2 decreased by 17.7%, indicating a growth in demand and tightening market conditions.
Geographically, apartment demand growth has been predominantly driven by the South region, accounting for nearly 60% of annual absorption with approximately 226,000 units. The West region experienced its highest annual absorption in two years at about 89,000 units. Meanwhile, the Midwest and Northeast regions had moderate annual absorption figures of 44,100 and 30,500 units, respectively, while facing moderate supply pressures that permitted slight increases in their annual rent growth.
Since the third quarter of last year, national effective rent growth has been stable, with rental prices ranging between $1,807 and $1,828, indicating that prices are adjusting in a controlled manner without extreme fluctuations typical of market imbalances. Similarly, consistent occupancy rates during this period suggest that available apartments are being leased at a steady pace, reflecting a closer alignment between supply and demand.

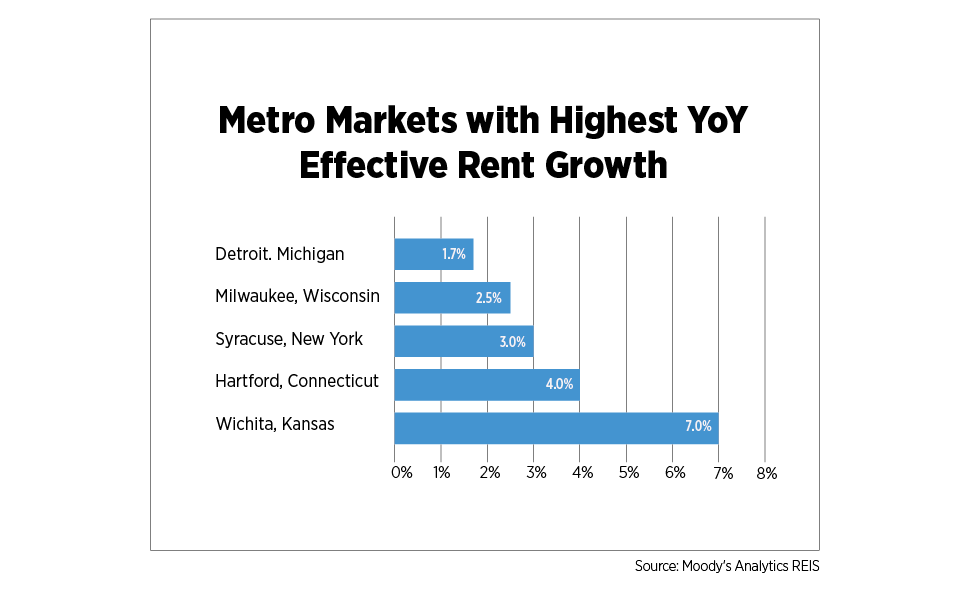
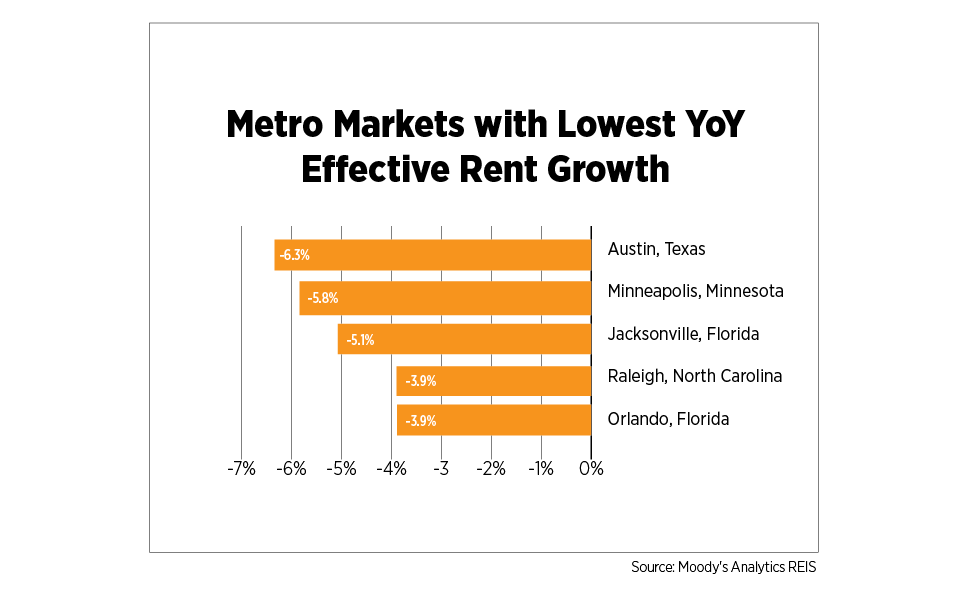
Year-over-year effective rent growth varies across 79 markets analyzed by Moody’s Analytics REIS. Among the top 15 markets with positive trends, 80% are in the Midwest and Northeast regions, with rent growth rates ranging from a peak of 7.0% in Wichita, Kan., to 1.1% in Little Rock, Ark. On the flip side, about 62% of the total markets analyzed saw a decline in rent growth over the past year. The metropolitan areas with the lowest effective rent growths were Austin, Texas (-6.3%); Minneapolis (-5.8%); Jacksonville, Fla. (-5.1%); Raleigh-Durham, N.C. (-3.9%); Orlando, Fla. (-3.9%); and Tampa-St. Petersburg, Fla. (-3.8%). Conversely, the metro markets with the highest year-over-year rent growths were Wichita (7.0%); Hartford, Conn. (4.0%); Syracuse, N.Y. (3.0%); Milwaukee (2.5%); Detroit (1.7%); and New York (1.7%).
U.S. Capital Markets
Apartment sales volume as at Q2 2024 was reported at $22.3 billion, which represents an increase of 36.7% from the previous quarter and 11.1% year-over-year, according to CoStar. After experiencing significant declines for three consecutive quarters between Q2 2022 and Q1 2023, there was a mild recovery from Q2 2023 to Q3 2023, followed by ongoing fluctuations, signaling a moderately unstable market. The market seems to be experiencing periods of adjustments with moderate improvements toward mid-2024. Persistently high interest rates and rising economic instability make investors more risk-averse, which are some factors contributing to variations in sales volumes. Markets that experienced the highest annual declines in total sales volume were Dayton, Ohio; Buffalo, N.Y.; Cincinnati; Boston; and Milwaukee.
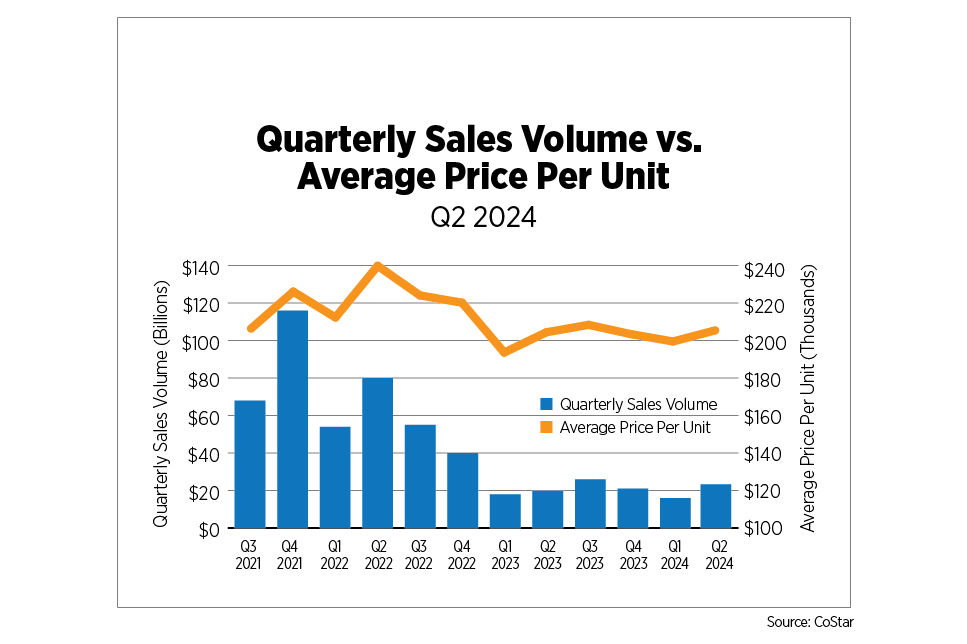
The second quarter’s national average price per unit was recorded at about $206,000, indicating an annual rise of 0.7% and a quarterly rise of 3.1%. The markets with the highest sales price per unit, ranging between $340,000 and $490,000, were San Jose, East Bay, Orange County and San Diego in California as well as Boston and Washington, D.C. Meanwhile, the markets experiencing the highest quarterly sales volume were New York, Phoenix, Los Angeles, Washington, D.C., Atlanta and Seattle, with values ranging from about $1 billion to $1.8 billion.
U.S. Build-to-Rent Market
By Q2 2024, national effective rent growth increased to $2,188, reflecting a 1.9% year-over-year growth. According to Yardi’s single-family build-to-rent (BTR) national trend report, rent has been rising consistently over time, with a two-year increase of 5.8% and a five-year increase of 35.8%. Occupancy levels remained stable at 92.6%, despite a year-over-year decline of 1.3 percentage points. Quarter ending statistics from Yardi revealed the top six markets with the lowest occupancy levels: Dallas (82.3%), Jacksonville (81.9%), Orlando (77.9%), Atlanta (75.3%), Huntsville, Ala. (72%), and Hickory, N.C. (67.4%).
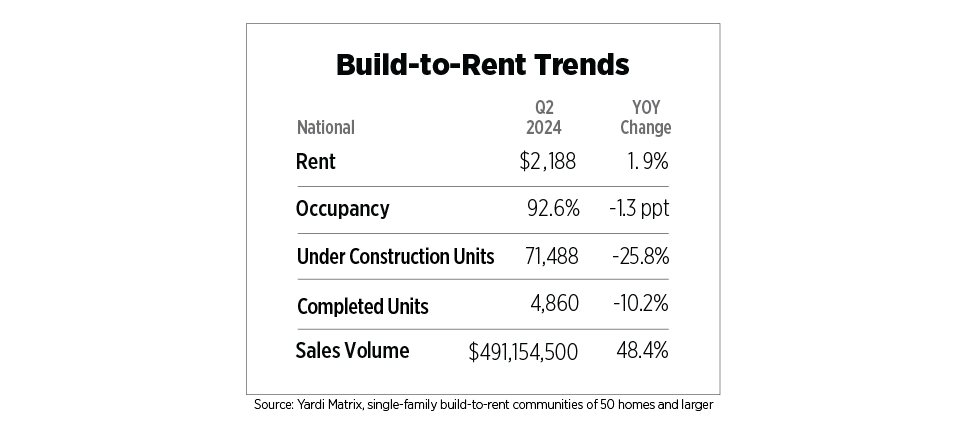
The transaction volume increased to about $491 million, more than twice the amount reported in the previous quarter. This surge signifies a 48.4% rise compared to the previous year, indicating a significant growth in sales activity within the industry. On the other hand, construction plummeted. The number of housing units being built has decreased for three consecutive quarters and has dropped by 25.8% compared to the preceding year, indicating a gradual downturn in new construction activity. Units under construction as at the end of Q2 2024 reduced to 71,488 units, marking the lowest development level since Q3 2021. Likewise, the number of completed units in the market has dropped significantly, reaching its lowest level since Q1 2023 at 4,860 units, reflecting a decline of 10.2% year-over-year and 6.4% quarter-over-quarter. According to Yardi, as at Q2 2024, the markets witnessing the largest number of completed units were Phoenix (711), Dallas (386), west Houston (366), Charlotte, N.C. (308), Fort Worth, Texas (264), and Atlanta (232).
U.S. Economy
Consensus around the achievement of a soft landing in the U.S. economy is building, but downside risks are palpable. The for-sale housing market is showing signs of weakening yet again, but this time cracks in demand rather than supply are beginning to emerge. Existing home sales fell to an annual rate of 3.9 million in June, the lowest level in six months, according to the National Association of Realtors. The supply of housing units on the market increased to 4.1 months at the current pace of sales, a level not seen since May 2020. The median sales price was $426,900, the highest level ever recorded and a clear signal that prices remain sticky against dampened demand.
New home sales also dropped to their lowest levels in seven months, as reported by the Census Bureau, with 617,000 homes sold. Inventory also increased, with 9.3 months of supply, the highest since October 2022. Prices for new homes were essentially flat year-over-year, with a median price of $417,300. The Case-Shiller Index, however, posted a 6.3% year-over-year increase in April (the most recent data available), taking it to its highest level since the data series began in 1987. Coupled with the 30-year fixed rate mortgage remaining at an average of 7.0% during Q2 2024, potential homebuyers are taking a breather, perhaps in hopes of mortgage rates easing with a future Fed rate cut.
The pending home sales index, also published by the National Association of Realtors, is a leading indicator which measures signed contracts, which typically precede sales by one to two months. The index has declined for two consecutive months to its lowest level on record.
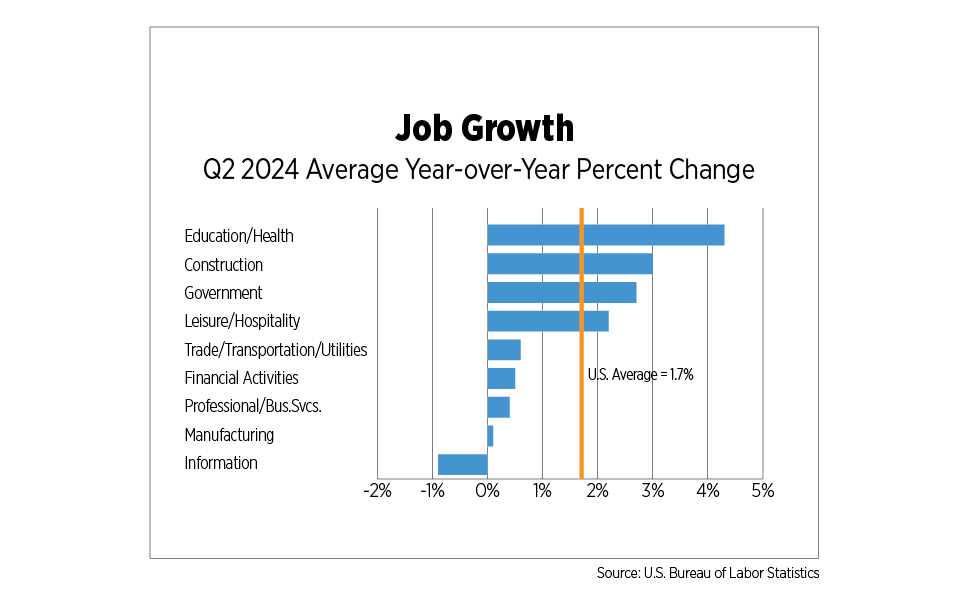
Confirmative signs for the soft landing include the labor market, which continued to soften further with the monthly average job gain for Q2 at 177,000 compared to 274,000 in Q2 2023. Breaking down jobs by major sector shows several sectors stagnating or actually losing jobs. Growth rates in the education/health, construction, government and leisure/hospitality sectors outpaced the national average in Q2 2024. The beleaguered tech sector contracted during the second quarter while financial activities, which includes the real estate sector, professional/business services and manufacturing, grew by less than 0.5%.
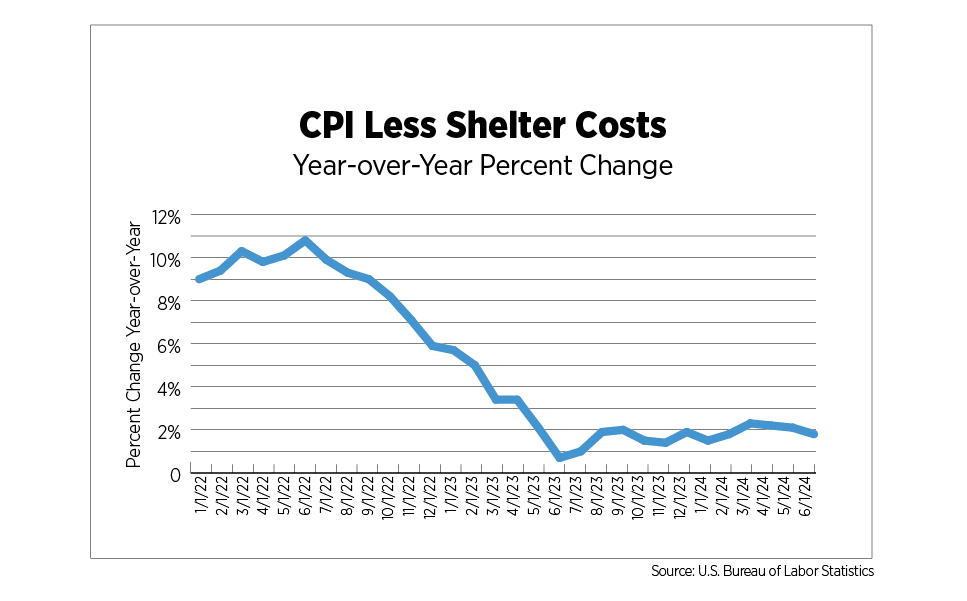
The Fed has all but signaled it will cut rates this year but has reiterated that it needs to be more confident that its dual mandate, maximum employment and stable prices are being met. In addition to more muted job growth, the unemployment rate has begun to tick up, although it remains low by historical standards. And after an increase in several measures of inflation in Q1 2024, they are now heading in the right direction. When stripping out shelter costs, one of the main drivers of persistent inflation, the CPI has been within or below the Fed’s 2% target range for the past 14 months.
Outlook
The apartment sector is holding up well, considering decades-high levels of deliveries. Demand has been strong, and rent growth is returning to markets with low or moderate levels of new construction. Markets that were flooded with demand and met that demand with new properties in the wake of the pandemic are still seeing elevated concessions and declining rents.
Outside of the regulatory and legislative environment, which appears likely to remain a top industry challenge for the foreseeable future, the main obstacle lies with interest rates. Transaction activity has shown some signs of bottoming out, but most deals still won’t pencil. The Q2 2024 Johns Burns/NAA Apartment Development & Investor Survey found that 30% of investors expect average per unit prices to decrease over the next 12 months. While the much-touted distress has yet to proliferate in the apartment sector, the number of troubled assets is on the rise, with MSCI tracking $14 billion worth at the end of Q2. Additionally, some 22% of multifamily loans are scheduled to come due in 2024 and 2025, according to the Mortgage Bankers Association. While many of those have already been, or will be, extended and/or modified, the nearly half a trillion-dollar price tag on these loans is staggering to contemplate.