CPI, Latest Release, November 2024
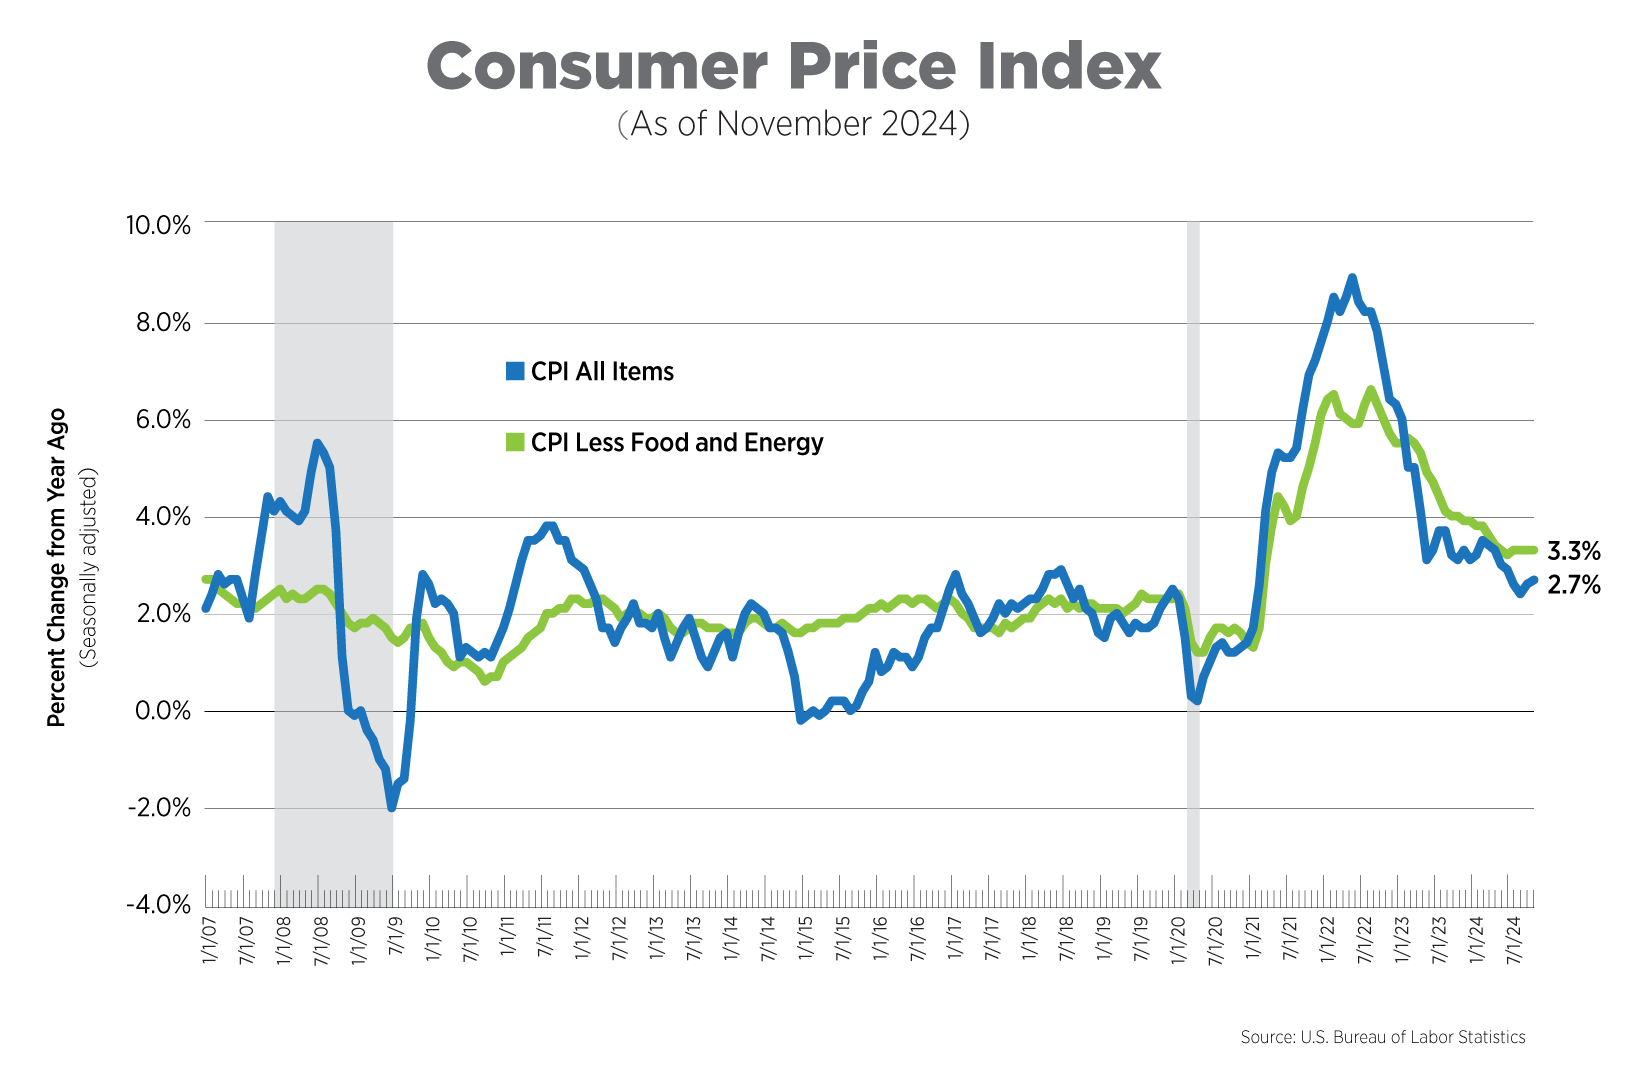
Headline CPI came in exactly as expected, rising 2.7% year-over-year and 0.3% over the month. Shelter costs were once again the largest driver, responsible for nearly 40% of the increase this month. Food prices rose 0.4% while energy prices were up 0.2%. There were also no surprises from core inflation, which has been stuck at 3.3% year-over-year for the past 4 months. Outside of shelter, monthly price gains were also driven by used cars and trucks; tobacco and smoking products; and new vehicles.

CPI for Housing, November 2024
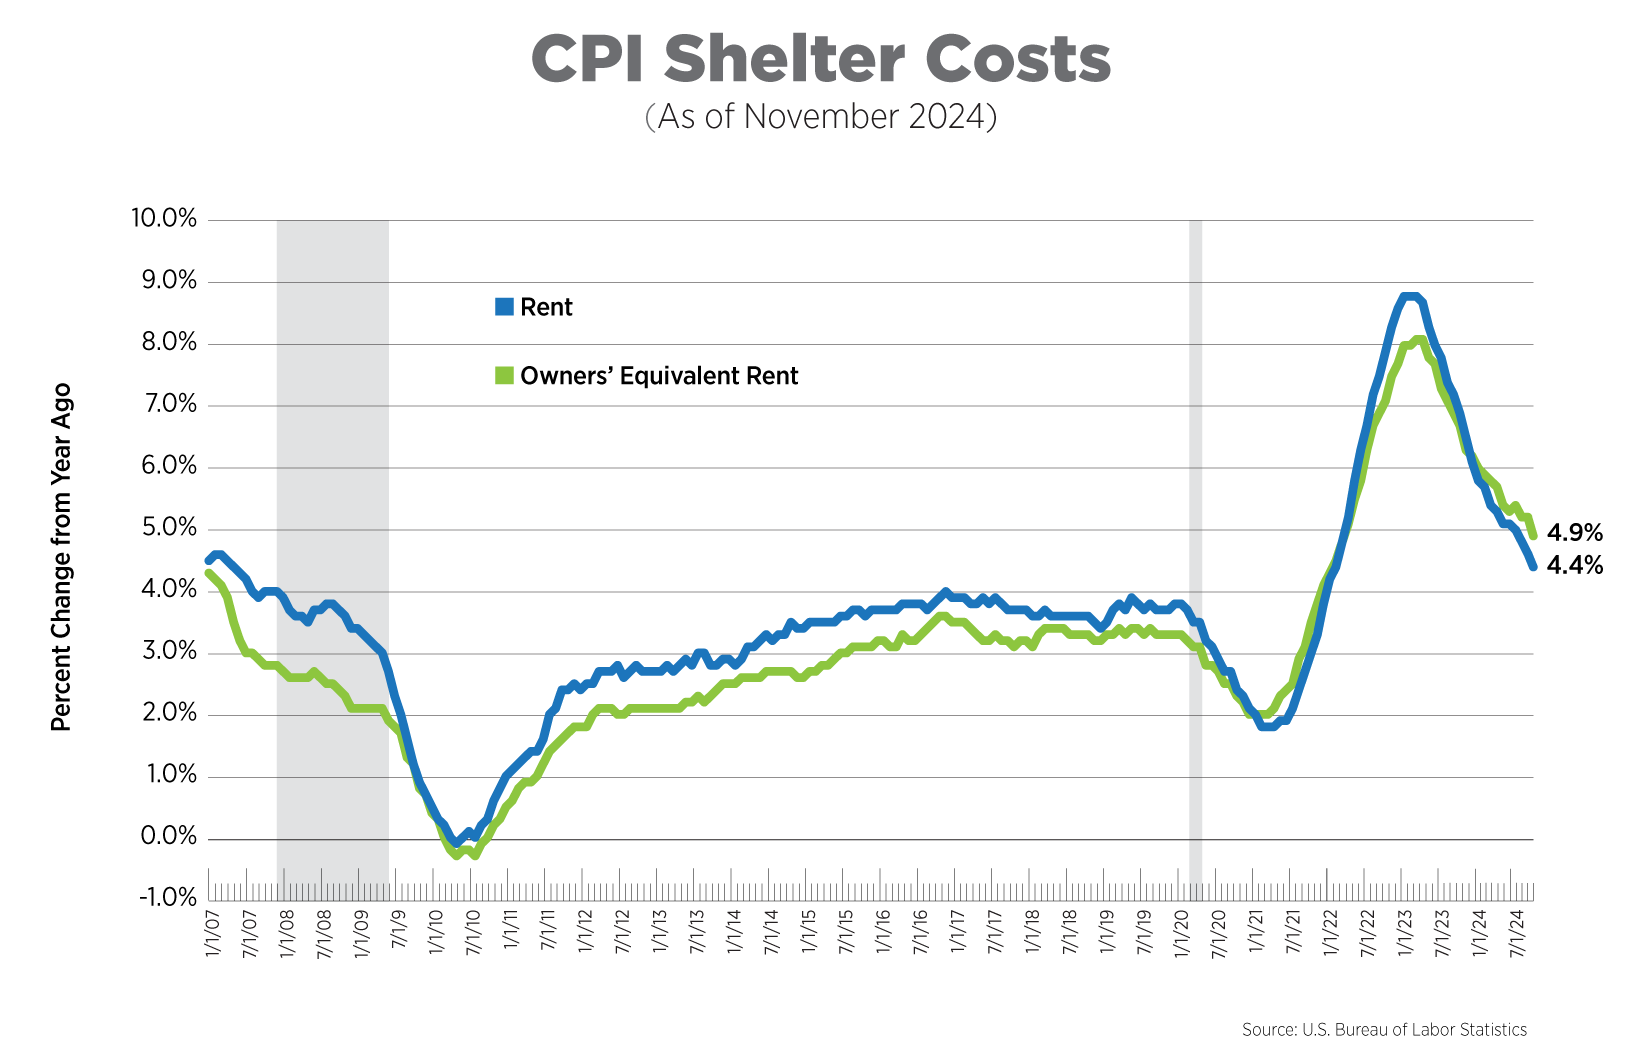
The CPI includes two measures for shelter costs: owners’ equivalent rent (OER) and rent of primary residence, both of which are self-reported. Together, they comprise about one-third of CPI. Both rent and OER continued their steady deceleration, increasing 4.4% and 4.9% year-over-year, respectively, the lowest levels since early 2022. The 0.2% monthly increase for OER, its lowest point since April 2021, was notable. More readings like this may finally mean that shelter costs are catching up with market-based data. The New Tenant Rent Index, the BLS quarterly measure of prices renters would pay if they changed housing units that period, showed modest increases in Q3 2024 of 0.8% quarterly and 1.0% year-over-year. Both Yardi and RealPage reported rent declines in November, in line with normal seasonal patterns, as well as modest increases of less than 1.0% year-over year.

Super Core Inflation, November 2024
Due mainly to lags in CPI shelter data, the Fed has begun to focus more on “super core” inflation, that is, prices excluding food, energy and shelter. Super core inflation increased 2.2% year-over-year, matching levels from earlier this year and erasing progress made over the summer. Monthly changes paint a more positive picture, showing prices stabilizing over the past two months and even declining slightly in November.

Inflation Expectations, November 2024
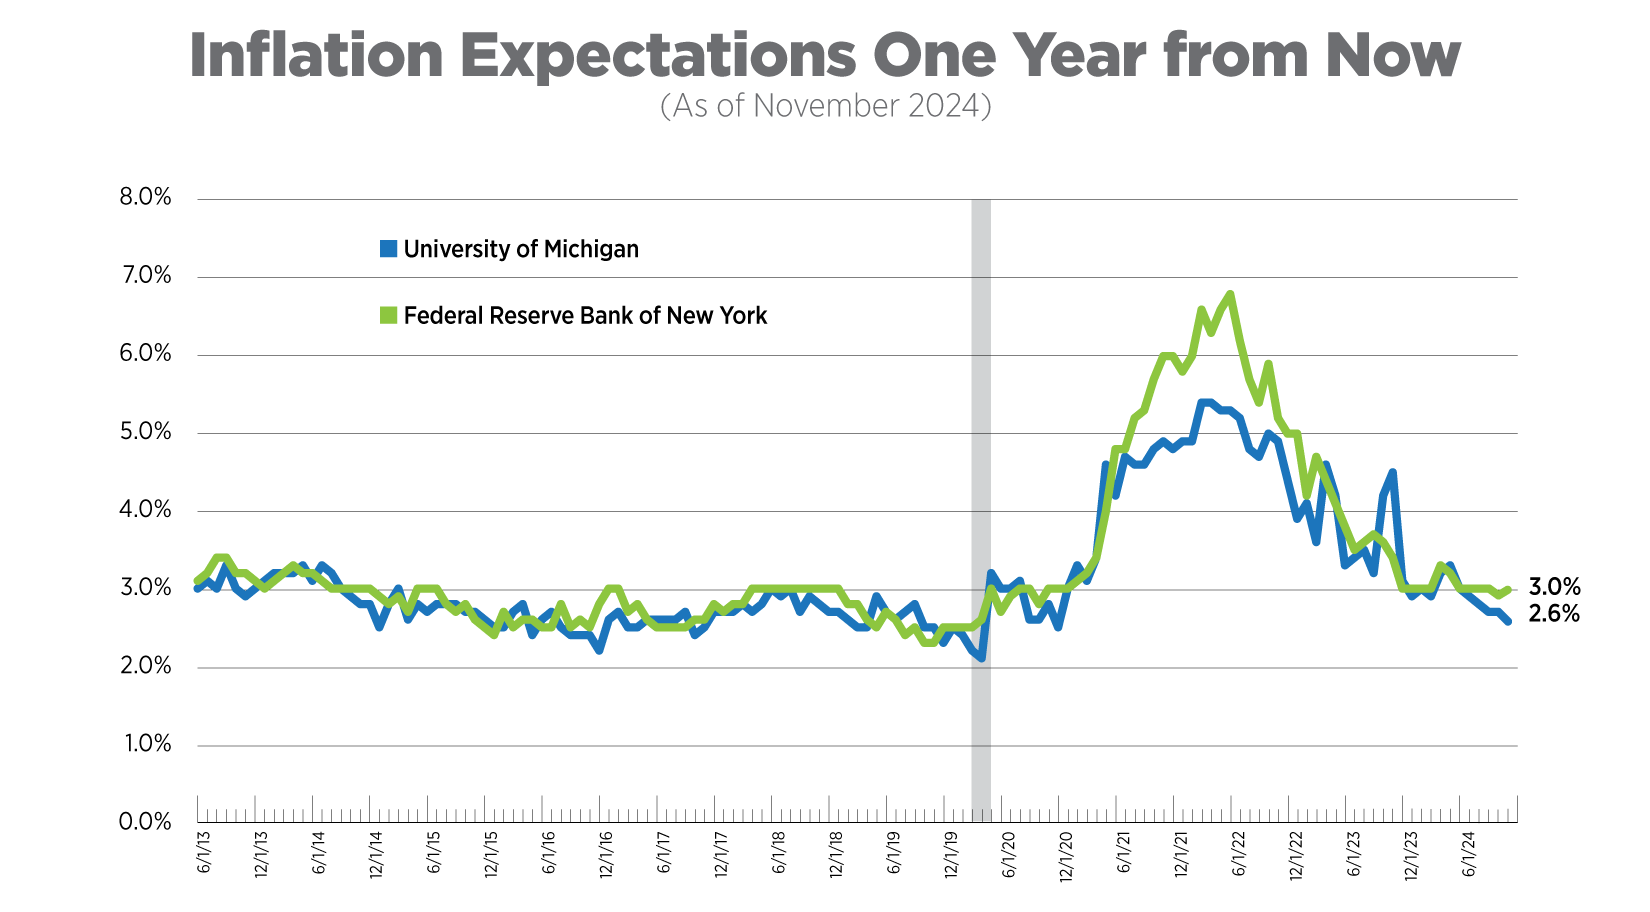
The Fed tracks 21 different measures of inflation expectations. The data presented in the chart below are inflation expectations one year from now from the Federal Reserve Bank of New York’s Survey of Consumer Expectations and the University of Michigan’s Consumer Sentiment Index. The final November reading of the Michigan index ticked down slightly to 2.6%, its lowest level since the end of 2020, while the New York Fed index inched up to 3.0%. Households in the Fed’s survey were more optimistic about their financial situations one year from now, but job market expectations declined and the outlook for spending moderated further.

Wage Growth vs. Employment Cost Index, Q3 2024
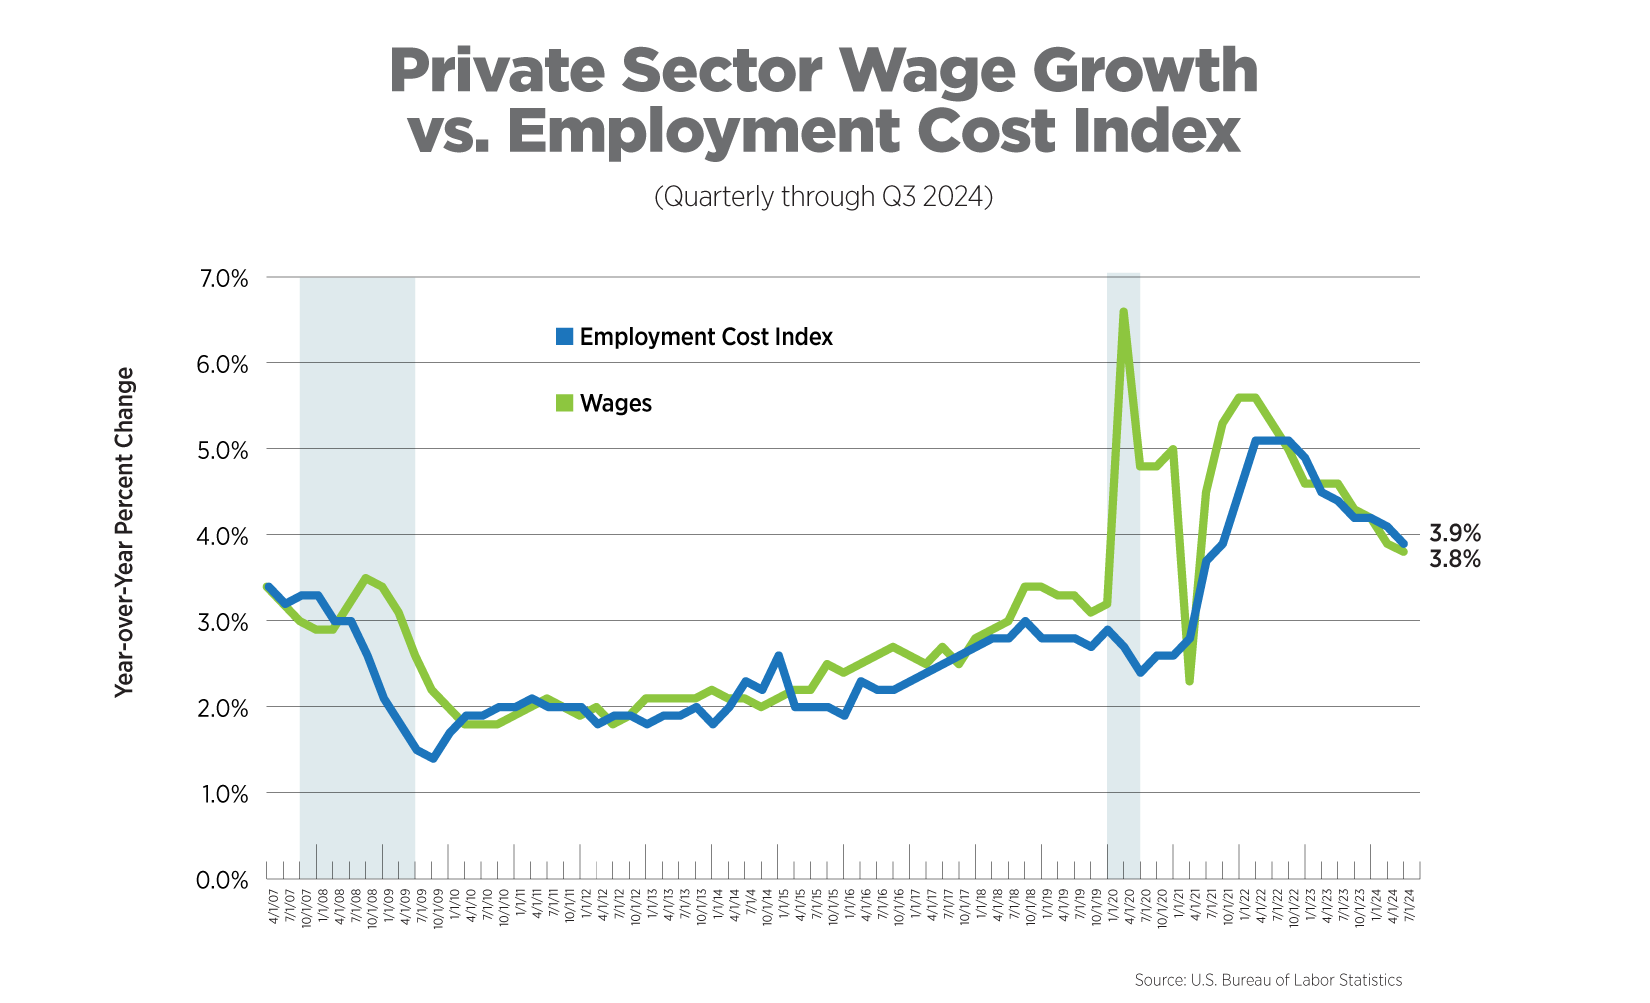
The Employment Cost Index (ECI) is a quarterly measure of the change in the costs of labor. Unlike average hourly earnings, the series typically used for wage growth, the ECI calculation is not impacted by the change in employment levels among occupations and industries which can significantly skew wage levels. It also includes the costs of benefits to employers. The ECI is considered a purer measure of labor costs and is closely watched by the Fed. Despite its stickiness, quarterly averages for wage growth have decelerated for ten consecutive quarters. The ECI has decelerated or flattened over that same time period, but it, too, remains elevated compared to pre-2020 averages. Breaking down the ECI reveals the costs of wages, salaries and benefits decelerating at a fairly even pace over the past year.

What to Watch in the Next Month
Today’s inflation report, exhibiting stickiness particularly in services inflation, all but ensures a Fed rate cut at its December 18th meeting. The CME FedWatch Tool shows a 96% probability of a 25-basis-point decrease.
