
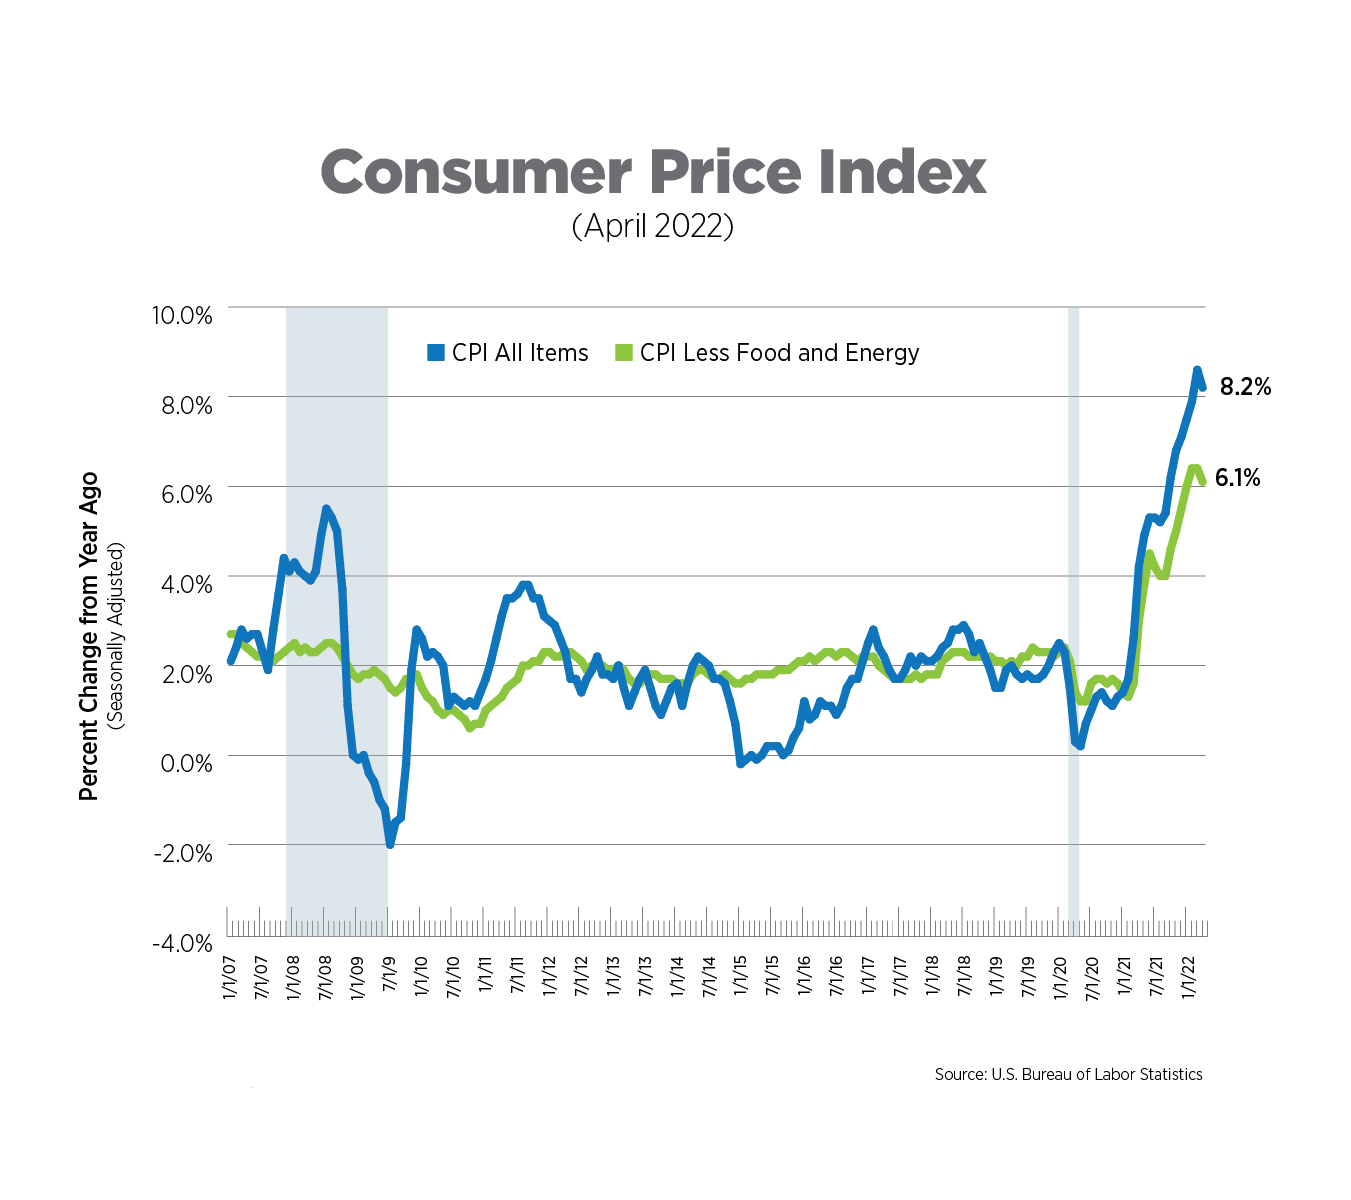
CPI, Latest Release, April 2022
After 7 months of smashing records, the headline Consumer Price Index (CPI) retreated slightly to 8.2% year-over-year (8.3% unadjusted). This was somewhat hotter than analysts’ expectations of 8.1%. Although it’s only one month of data, it is a good sign that inflation may have peaked. If this rate of decline continues, CPI would still average 7.0% in 2022, a 40-year high. On a monthly basis, prices increased by just 0.3%, the lowest level since August. Core CPI (excluding food and energy prices) was up 0.6%, with the largest monthly increases in airfares (18.6%), men’s suits (6.6%) and window coverings (4.7%).
A decline in price increases, particularly at this level, will not impact the Fed’s stated policy actions of increasing the Federal Funds Rate by 50 basis points several more times this year.
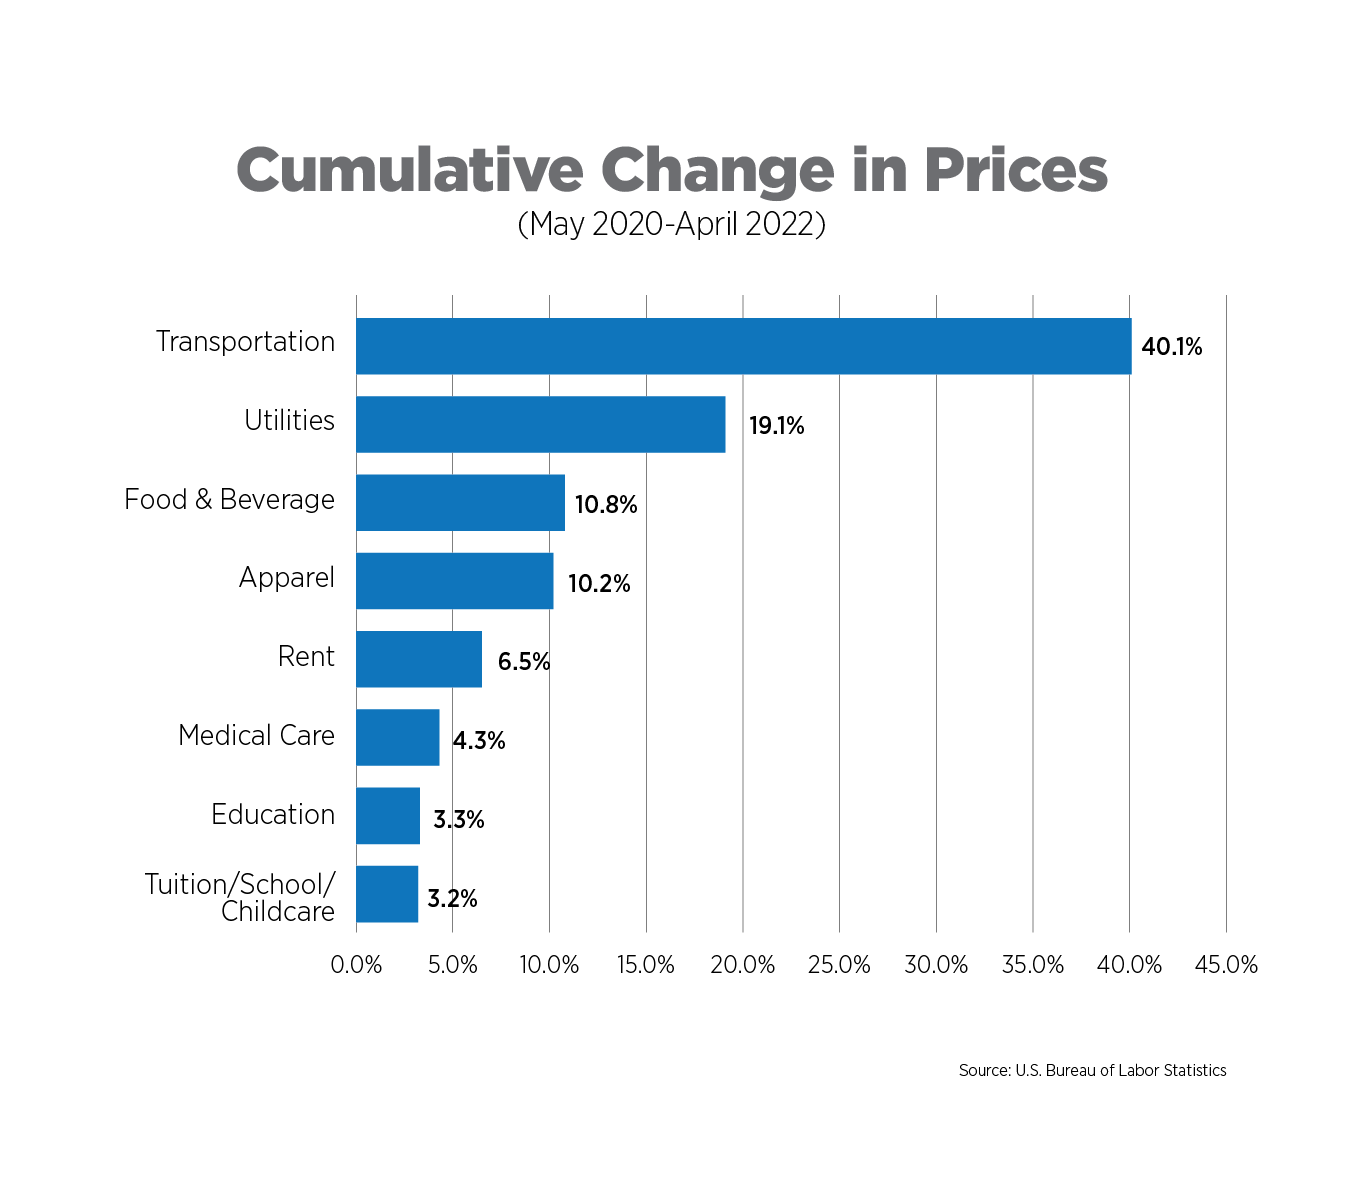
Cumulative Price Changes, Selected Components, April 2022
The BLS aggregates special categories of goods and services, several of which are presented in the chart below. The trough for CPI for this cycle occurred in May 2020 during the depths of the pandemic. Consumers who purchased new or used cars and trucks felt the most pain throughout this time, with prices rising 40.1%, on average. Household fuels and utilities increased 19.1%, while food and beverages were up nearly 11%. The CPI measure of rent of primary resident increased a more moderate 6.5%. It's important to remember that this component is self-reported and lags actual rent growth as the data are collected less frequently than other components of the CPI. Based on numerous third-party data sources, which show double-digit rent growth occurring across the U.S., we can expect further upward pressure on the BLS measure.
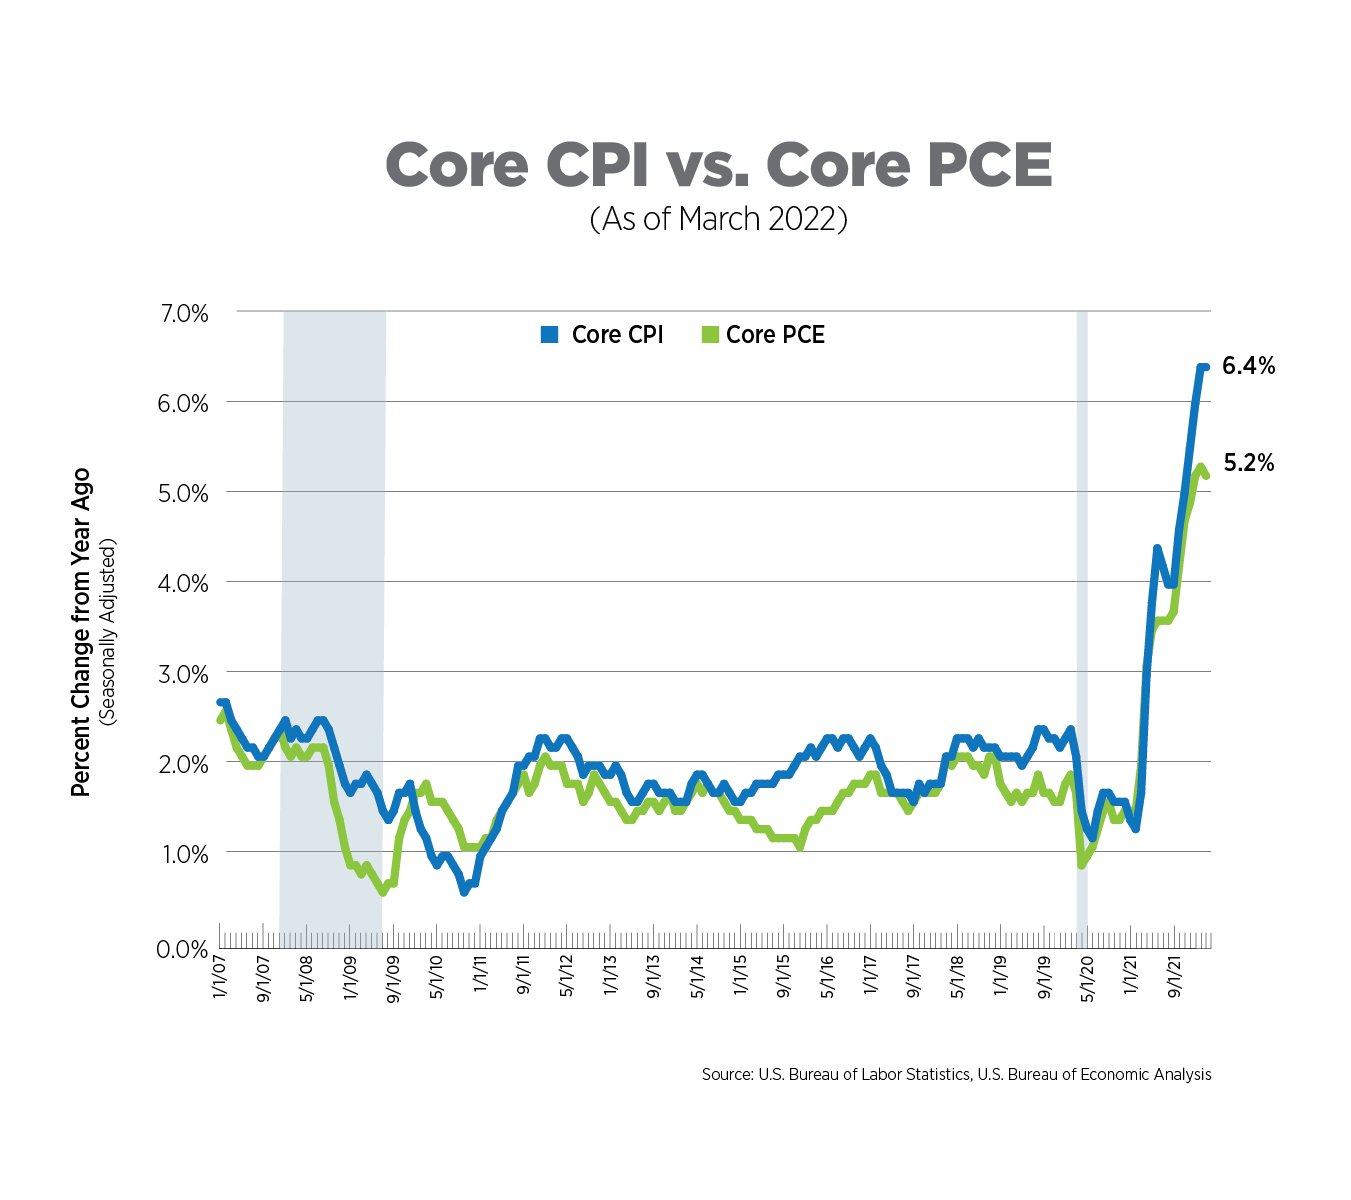
Alternative Measures of Inflation, March 2022
The core Personal Consumption Expenditures (PCE) Index is the measure of inflation the Federal Reserve Bank uses in its policy decisions. It is produced by the Bureau of Economic Analysis and uses different formulas, different weights and has a different scope compared to the Bureau of Labor Statistics’ (BLS) CPI.
Core PCE was up 5.2% year-over-year and has remained basically flat for the past three months. The gap between core PCE and core CPI was at its widest point since 2001. On a monthly basis, prices have stabilized at a 0.3% increase. Nondurable goods were responsible for much of the increase in March, rising 2.8% since February while the services component increased 0.4%.
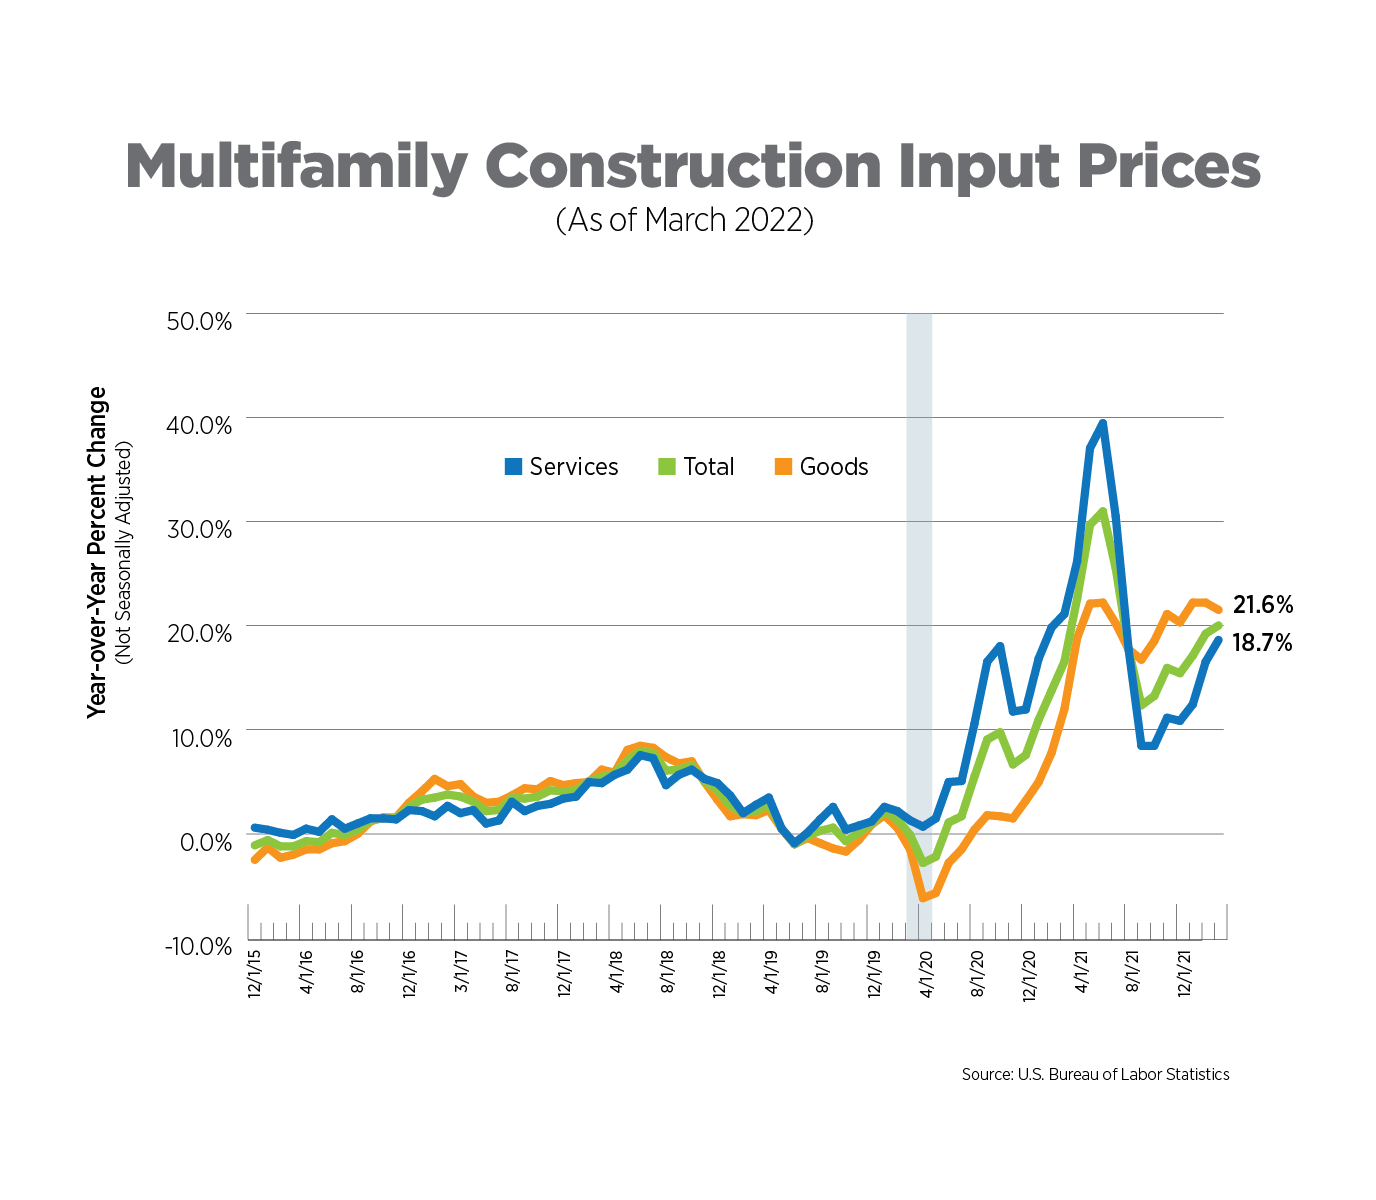
Multifamily Construction Input Prices, March 2022
The Producer Price Index includes a compilation of prices which measures all inputs to multifamily construction, excluding capital investment, labor and imports. For goods, this means lumber, gypsum, steel and other building materials. For services, this includes financial, legal, engineering, architectural and transportation services, among others.
Costs for construction show no signs of abating as goods topped 20% annual increases for the past 5 months, while services costs were in the double digits and closing in on 20% increases by March. Shipping costs have risen for 19 consecutive months, according to the IHS Markit Engineering and Construction Cost Index. Russia’s prolonged war on Ukraine and intensive Covid lockdowns in China will do nothing to help alleviate supply chain bottlenecks and consequential price increases.
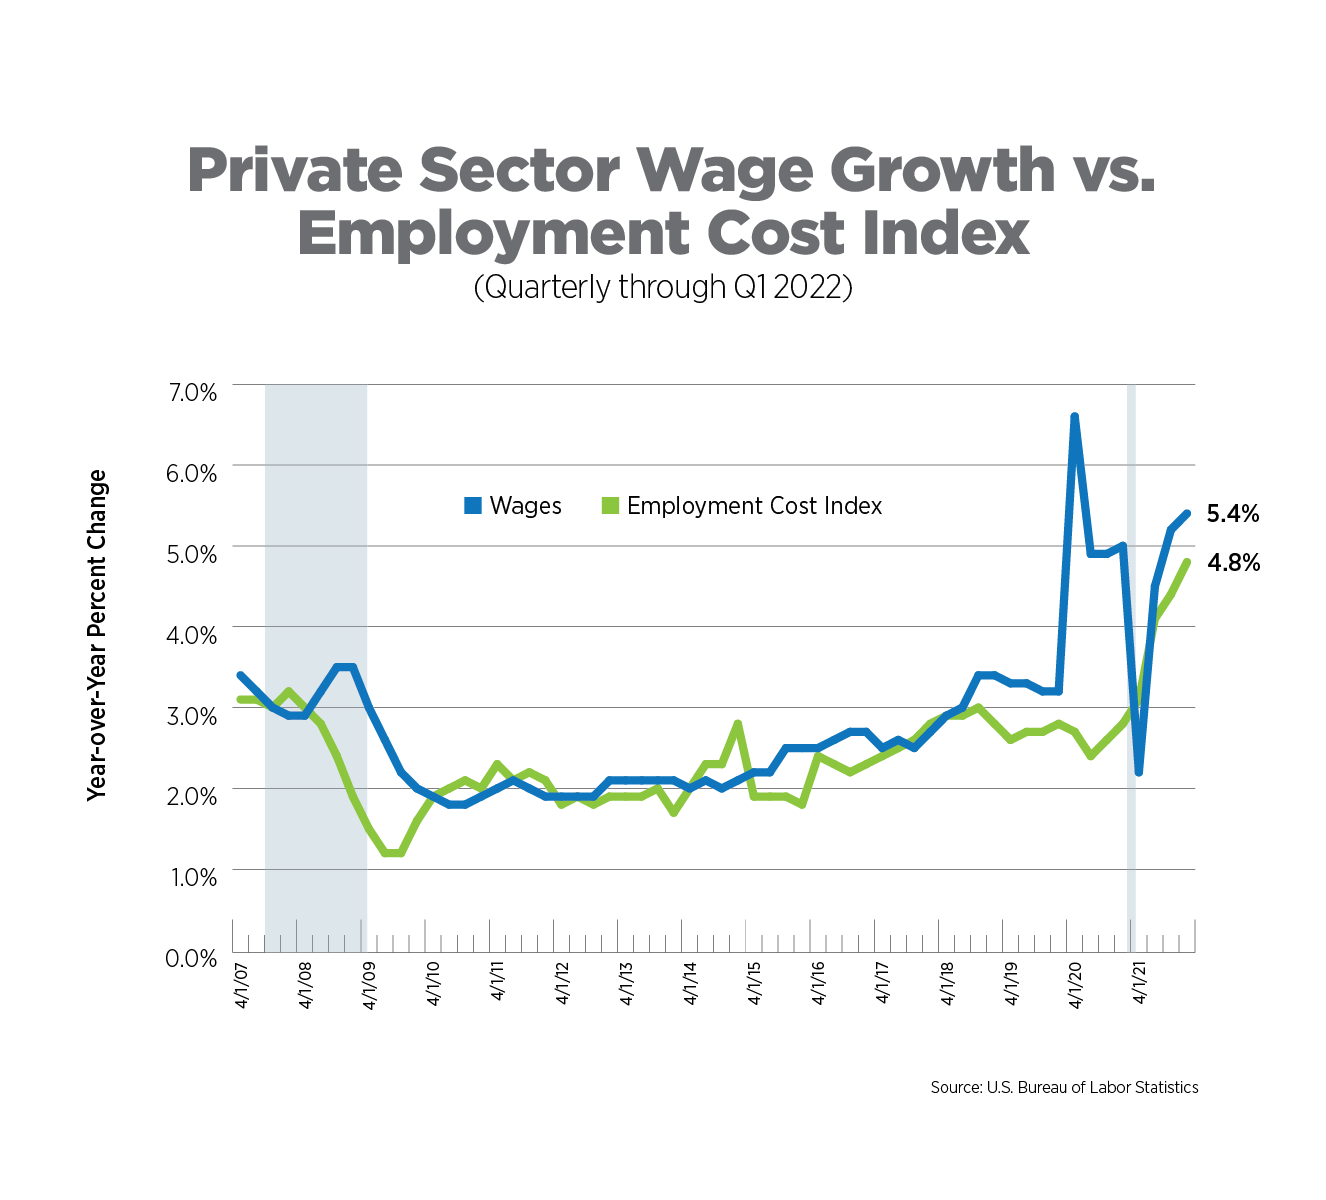
Wage Growth vs. The Employment Cost Index, Q4 2021
The Employment Cost Index (ECI) is a quarterly measure of the change in the costs of labor. Unlike average hourly earnings, the series typically used for wage growth, the ECI calculation is not impacted by the change in employment levels among occupations and industries which can significantly skew wage levels. It also includes the costs of benefits to employers. The ECI is considered a purer measure of labor costs and is closely watched by the Fed.
The ECI increased 4.8% year-over-year, its fastest pace since the early 1990s, with the wages and salaries component rising 5%. After averaging 2.3% increases throughout the pandemic, which were largely in line with pre-pandemic levels, benefits shot up by 4.2%. With nearly two jobs available for every person looking for work, employers are investing more in benefits to help attract and retain talent. Wellness and mental health programs, for example, are becoming more commonplace, along with well-defined diversity, equity and inclusion initiatives.
What to Watch in the Next Month
The Fed has begun its precarious task of taming inflation by dampening demand while not driving the U.S. economy into recession. But supply-side issues beyond the Central Bank’s control continue to pose threats to economic growth. The second estimate of Q1 GDP will be released on May 26th and while it might rile already-volatile markets if it is not adjusted upwards, the Fed’s more aggressive half-point rate increase will not yet be reflected in these figures.
Next Tracker: June 10, 2022