While most economists and analysts expect rising inflation to be a temporary phenomenon, concerns continue to mount from businesses and consumers alike. With that in mind, the National Apartment Association (NAA) is launching an inflation tracker to keep its members informed and help them cut through noisy data—a result of uncharted territory created by the pandemic.
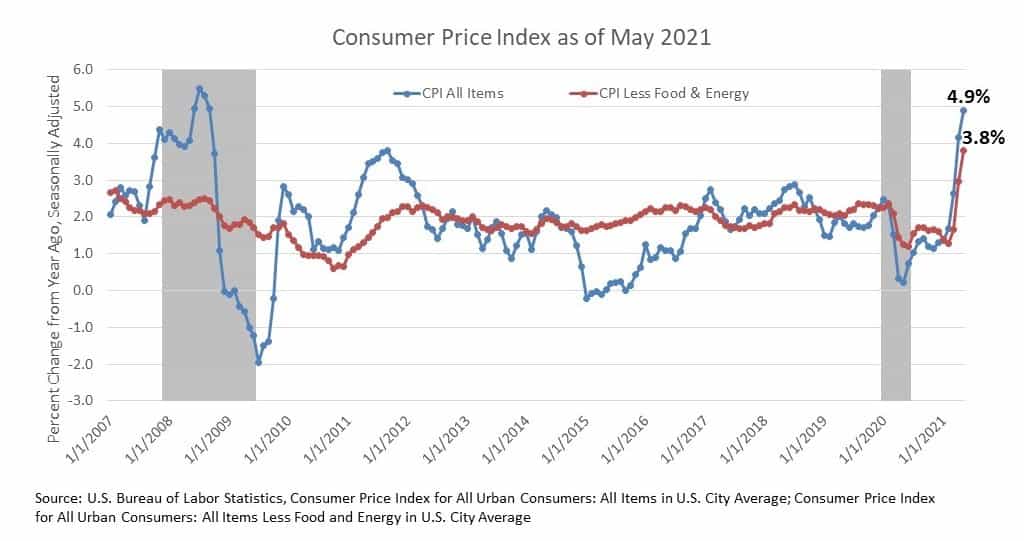
CPI, Latest Release, May 2021 4.9%
On a year-over-year basis, the Consumer Price Index (CPI) rose by its highest rate since 2008. It is important to note that part of this increase stems from the base month comparison of May 2020, when the Index was still declining in the wake of pandemic shutdowns.
Core CPI, which excludes volatile food and energy prices, rose to its highest level since 1992. Of the core components, some of the largest price increases were for used cars and trucks, car and truck rentals, airfares and car insurance. Demand for some of these items one year ago was nearly non-existent and prices adjusted accordingly. In the case of the auto insurance industry, many companies lowered their premiums to reflect decreased auto usage among those no longer commuting to work. In the case of used cars and trucks, demand has increased due largely to the semiconductor shortage plaguing the auto industry.
Alternative Measures of Inflation, May 2021
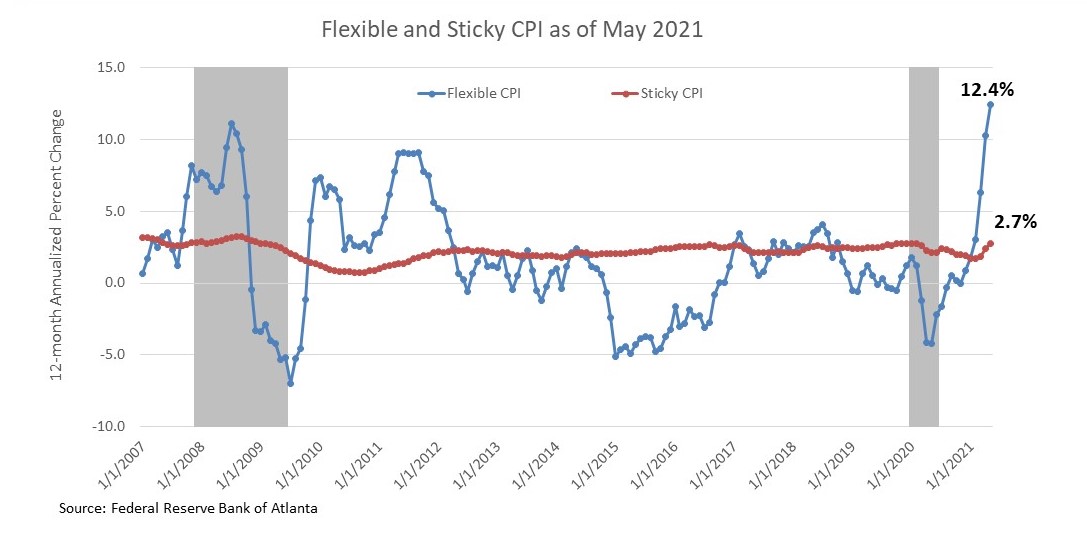
The Federal Reserve Bank (FRB) of Atlanta uses measures of inflation it refers to as “Flexible CPI” and “Sticky CPI,” basically categorizing CPI components by price volatility. Goods and services with sticky prices do not typically respond to changing market dynamics quickly – think rent, education and public transportation. Flexible prices change far more frequently and often wildly – think gas, food and hotels.
FRB Atlanta estimates sticky price goods and services comprise 70% of headline CPI and says these prices present a more forward-looking approach to inflation. Not surprising, sticky price CPI is a smoother data series over time, and between 2014 and December 2020, has consistently been above 2%.
Alternative Measures of Inflation, April 2021
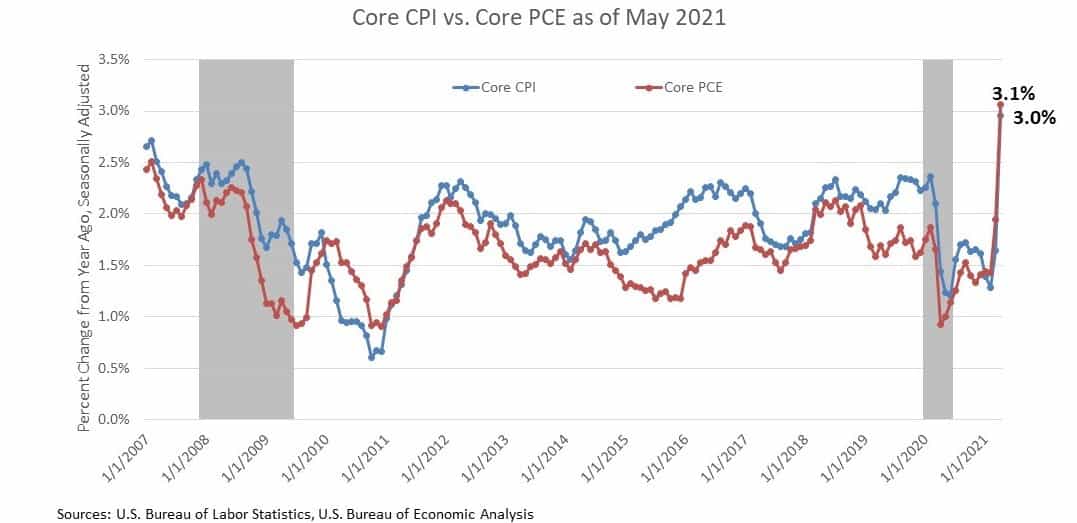
The Personal Consumption Expenditures (PCE) Index is the measure of inflation the Federal Reserve Bank uses in its policy decisions. It is produced by the Bureau of Economic Analysis and uses different formulas, different weights and has a different scope compared to the Bureau of Labor Statistics’ (BLS) CPI.
Although the two often track closely, April (the most recent data available) was the first time PCE rose above the Fed’s 2% long-term average target since December 2018. CPI, on the other hand, rose above 2% for 15 months during that same time period. At its current rate of 3.1%, it would take 11 months for the PCE to achieve a five-year average of 2%.
The Producer Price Index, April 2021
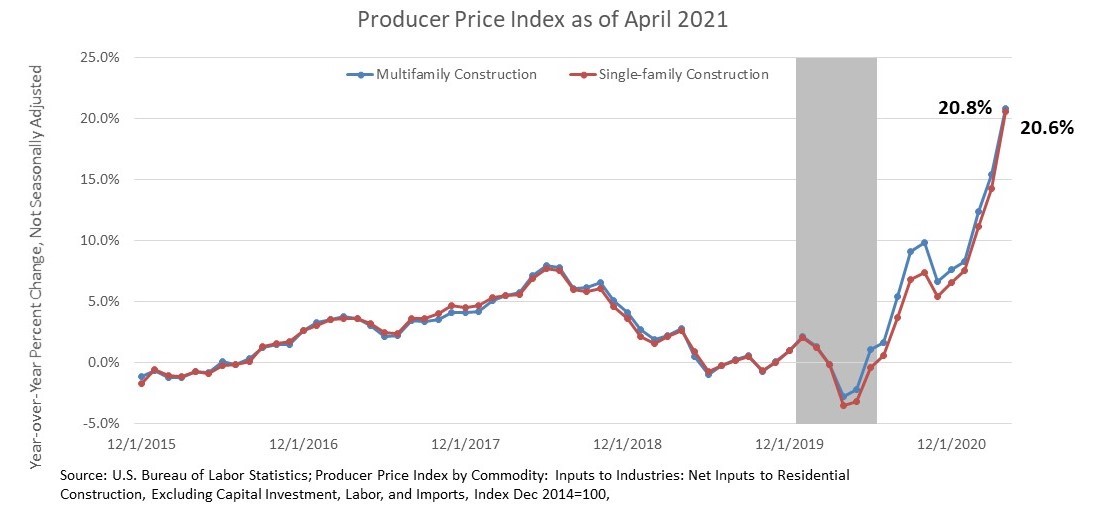
While lumber prices grab all the headlines, the BLS aggregates all construction inputs excluding capital investment, labor and imports for single-family and multifamily construction. Price increases for construction inputs have experienced double-digit growth for three consecutive months for both housing sectors.
Wage Growth, May 2021
Wage growth has been nothing but volatile during the past 14 months, spiking to 8.2% in April 2020, a reflection of lower-wage workers losing their jobs - and plummeting to just 0.4% in April 2021 as lower-wage workers were re-employed. Wage growth in May was moderate at 2% as lower-paying jobs continued to be filled. With job openings at an all-time high and widespread reports of hiring challenges across industries, more substantial increases in wages are expected in the coming months.

What to Watch Next Month
CPI began to increase again in June 2020, so base effects should start to ease. However, the timing for resolutions of supply-chain bottlenecks remains an unknown. And with summer upon us and the U.S. inching ever closer to 70% of its population being at least partially vaccinated, demand for goods and services is expected to stay elevated, resulting in further price pressures.
Next Tracker: July 13, 2021
