
Multiple factors are converging to disrupt everything we know about parking: Its physical structure, format, design, cost and, perhaps most important, demand. The urban revival leading to a reduction in the need for parking, electronic vehicles, autonomous vehicles and the sharing economy as it relates to auto use will all have major impacts on parking. Apartment community developers, owners and operators who are not yet addressing this in their business plans will find themselves missing opportunities for operational efficiencies and maximizing revenue sources.
Before looking ahead, a look back will reveal changes already underway.
Parking Ratios
Most metro areas across the U.S. experienced a decrease in ratios from 2006 to 2016.
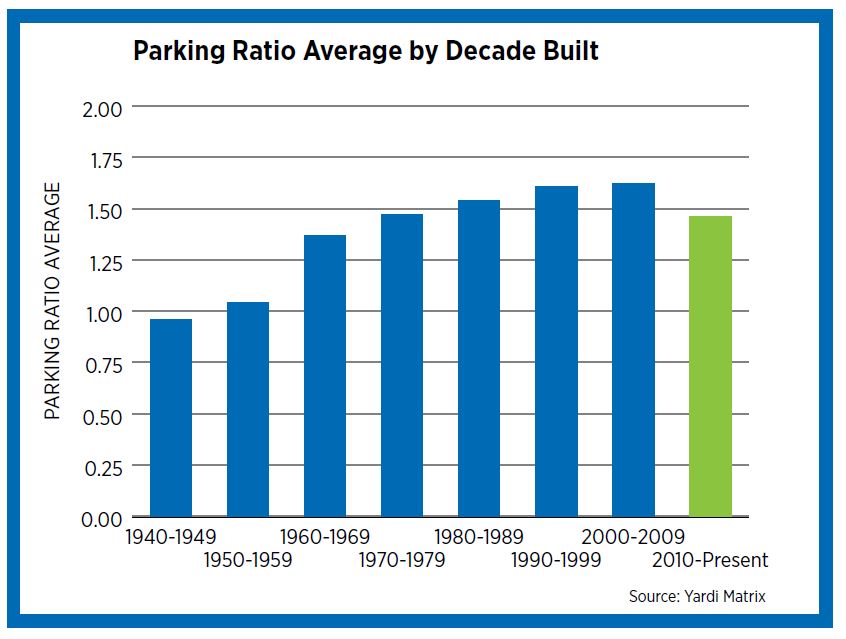
After rising consistently through the decades, the 2010s witnessed a decrease in parking ratios in newly constructed buildings across the United States. Average parking ratios for apartment properties with 50 or more units peaked at 1.62 in the 2000s before declining to 1.46 in the current decade, its lowest rate since the 1960s. This major shift coincides with the ongoing apartment boom of the current business cycle and reflects the increasing urban nature of residential development versus the overwhelming suburban character of residential developments in decades past.
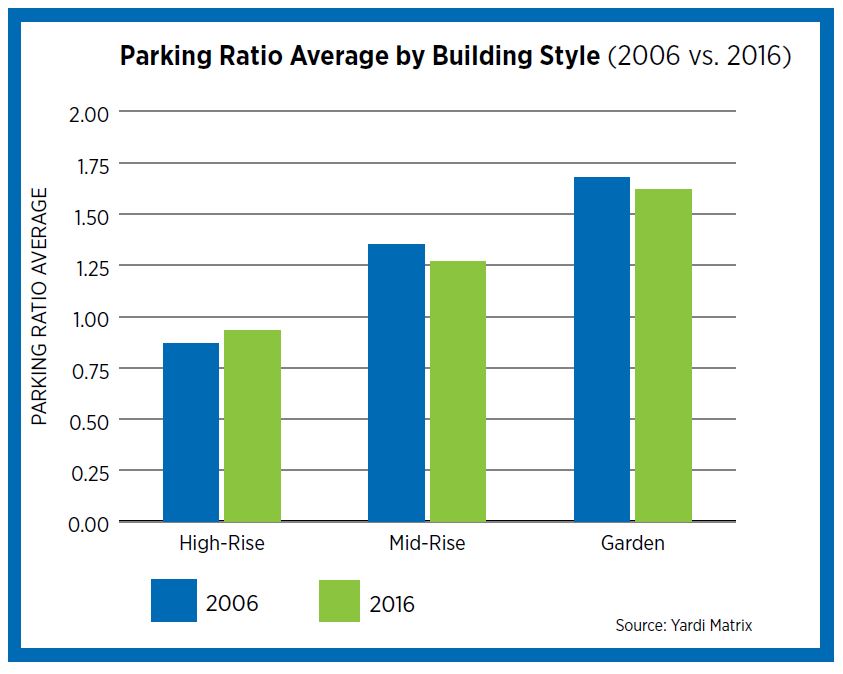
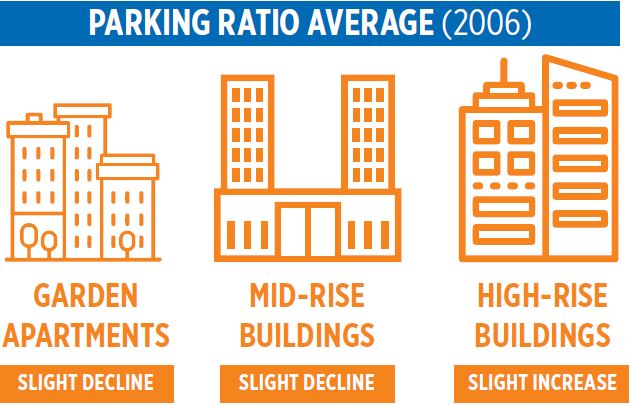
More recent changes reveal that the parking ratio average for garden apartments has declined slightly from 1.68 in 2006 to 1.62 in 2016. Similarly, the ratio for mid-rise buildings also declined from 1.35 to 1.27 during the same period. However, the ratio for high-rise buildings has risen slightly from 0.87 to 0.93, illustrating the fact that while changes are clearly underway, the societal car-centric nature remains strong and major shifts in attitude might take decades to play out in the data.
When analyzed by metro area, parking ratios were typically higher in the Sunbelt and lower for markets in the Northeast, upper Midwest, and Pacific Northwest. Developments in large Sunbelt metro areas originally required apartments to have more parking because of fewer public transportation options compared to their northern and western counterparts.
+0.14 Largest Increase in Parking Ratio - Nashville, TN
-0.84 Largest Decrease in Parking Ratio - Miami, FL
Differences in zoning regulations and existing density, as well as the age of buildings, also played important roles in this disparity. With the advent of ride-hailing as well as multiple modes of transportation options, the differences among regions will begin to wane. In fact, most metro areas across the U.S. experienced a decrease in ratios from 2006 to 2016, although a handful of markets like Nashville, Philadelphia, Austin and New York City saw slight increases.
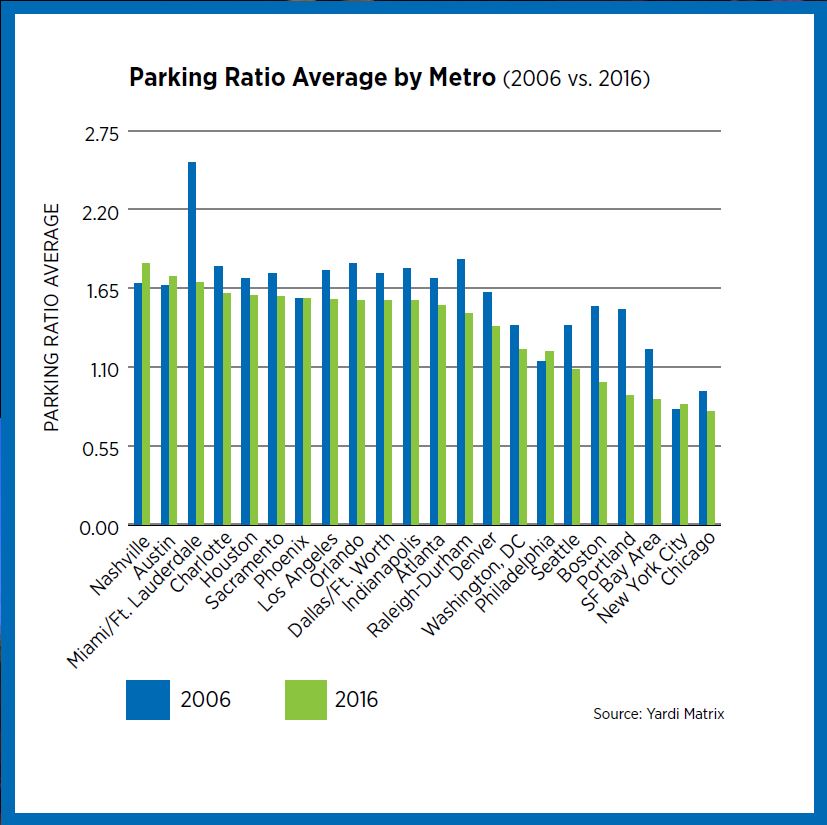
The steepest decrease in the average ratio occurred in the Miami/Ft. Lauderdale market, falling from 2.53, the highest of any major market in 2006, to 1.69 in 2016. This is mainly a result of the city eliminating minimum parking requirements, first for its downtown district in 2010 and then for developments outside of downtown comprising less than 10,000 square feet in 2015. The Portland market experienced the second largest decrease, with its average ratio falling from 1.50 to 0.90. With the city council having eliminated minimum parking requirements in 2017 for developments located near frequent transit and containing affordable units, further declines can be expected for the area’s average ratio.
Parking Structures
20.6 percent of new properties had multi-level structure parking in 2017.
The types of parking available at apartment properties have become substantially more diverse in recent decades. While the vast majority of properties (over 90 percent) constructed from the 1940s to the 1990s offered grade-level parking, in line with the dominance of the automobile-oriented lifestyle and suburban development patterns, the percentage of new properties with grade-level parking has decreased significantly to 61.5 percent in the present decade. Not surprising, other parking types have become more common given the surge in urban developments and inherent lack of available land.
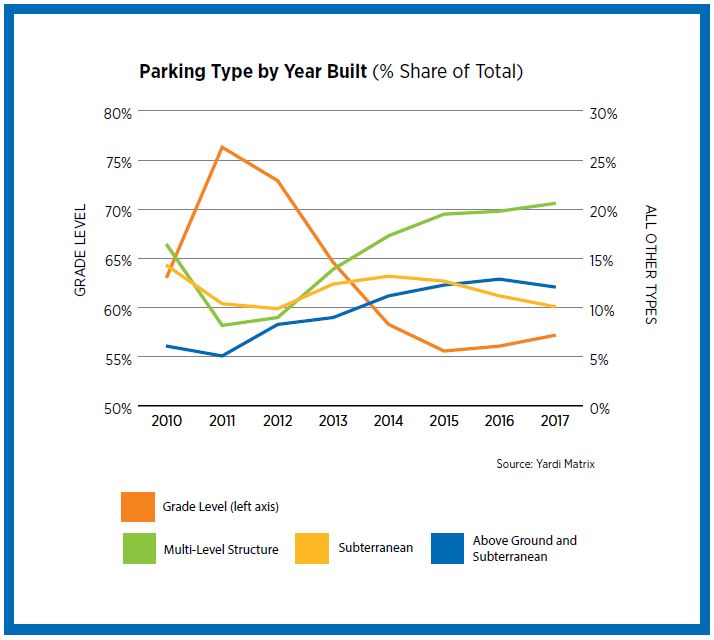
As of 2017, the share of new properties with multi-level structure parking, the second most popular type, was 20.6 percent, while a mix of above-ground and subterranean parking stood at 12.1 percent. In conjunction with decreasing parking ratios, the recent diversification of parking types available on apartment properties is further evidence of the increasingly diverse and urban nature of apartment development and design, even those located outside the city center.
73 percent of apartment properties with car charging stations built within the past ten years.
The number of newly constructed apartment properties with car charging stations steadily increased through much of this decade, according to data from CoStar. This trend is expected to continue given the surge in mainstream popularity of electric vehicles beginning in the early 2010s and mass-produced offerings from brands like Tesla, Nissan and BMW. Charging stations have clearly become a more popular community amenity for apartment developers looking to attract residents with specific lifestyle preferences.
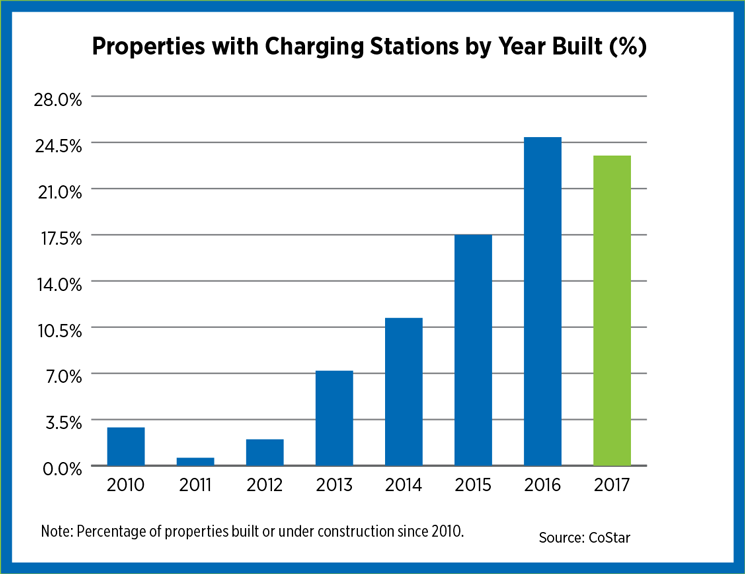
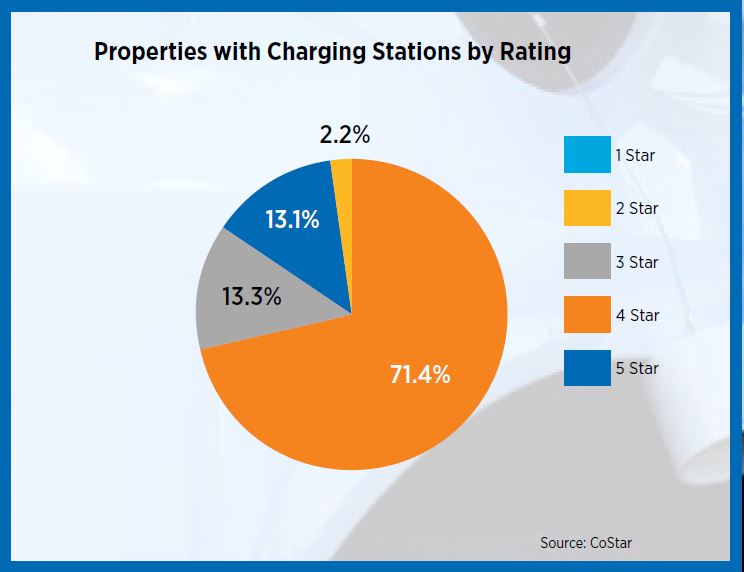
As expected, data suggest properties with charging stations are larger – typically containing 50 or more units – newer, and higher-end. About half of the properties contain 250-499 units and nearly 85 percent are considered 4- or 5-star, the most akin to a class A/A+ rating, according to CoStar.
Rent Premiums
Americans still love their automobiles...and are willing to pay for it.
Apartment residents are willing to pay more for parking, a testament to the fact that Americans still love their automobiles. Data provided by Enodo, Inc., a real estate predictive analytics company, for selected cities across the U.S. reveal premiums ranging from just over 1 percent of average monthly rent to nearly 5 percent.
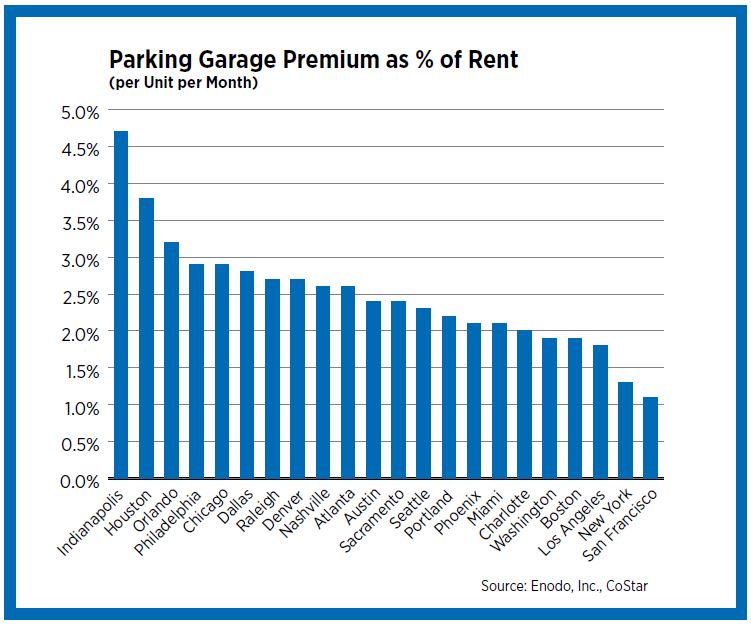
Unlike other amenity premiums, which often have an inverse relationship to the availability of that amenity in any given market or submarket, the cities that came out on top with the highest premiums are not necessarily those with the lowest parking ratios. In fact, Indianapolis boasts the highest rent premium for parking garages despite being in the middle of the pack for parking ratios among other areas. Other cities that are on the higher end of rent premiums span a variety of regions, including Houston, Orlando, Philadelphia and Chicago. Rent premiums for parking garages are lowest in New York and San Francisco, which have some of the lowest parking ratios; additionally, public transit is abundant and rates of car ownership are low.
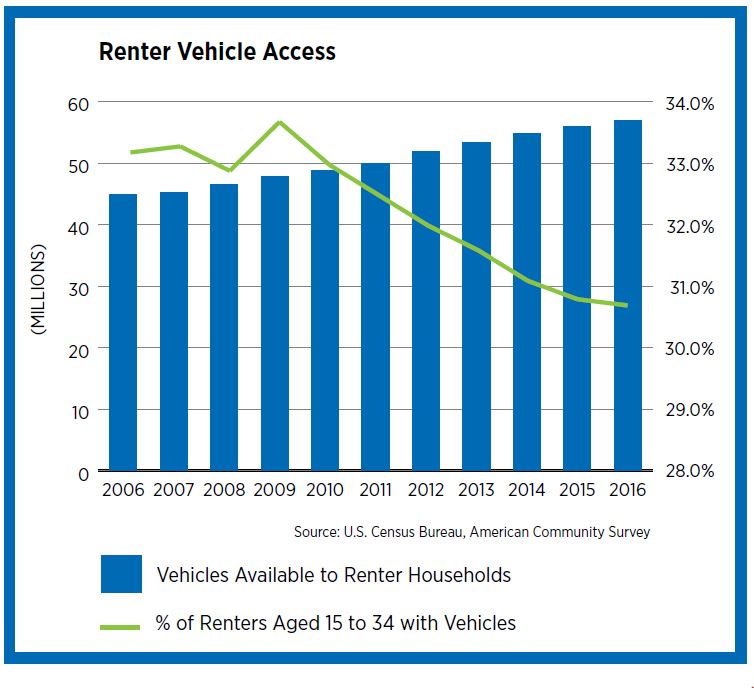
Vehicle Access
The decreasing popularity of vehicle ownership among Millennial renters is something to consider in future parking plans.
The number of vehicles available to renters saw an uptick from 2006-2016, according to the U.S. Census Bureau. Nevertheless, the portion of renters ages 15 to 34 with vehicles has decreased from a peak of 33.7 percent in 2009 to 30.7 percent in 2016. The decreasing popularity of vehicle ownership among Millennial renters is something to consider in future parking plans, especially if this downward trend persists.
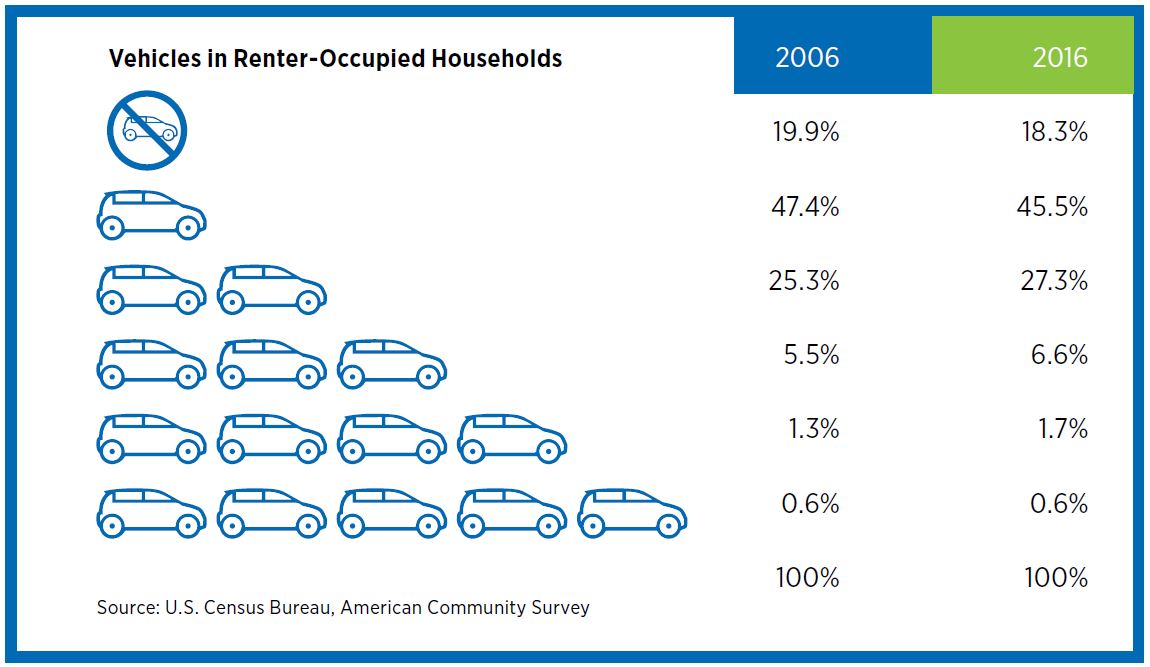
The share of renter-occupied households with no vehicle access decreased from 19.9 to 18.3 percent from 2006 to 2016; the share of renter-occupied households with one vehicle also decreased from 47.4 to 45.5 percent during the same period. At the same time, the percentage of renter-occupied households with two, three or four vehicles all increased. Since the number of vehicles per renter remained fairly steady during the past ten years, these changes reflect the increased popularity of roommate living arrangements.
The national rate of renters per household has increased from 2.41 in 2006 to 2.53 in 2016. It’s also important to note that these data encompass all rental households, including single-family rental housing that are more likely to be located in areas dependent on automobiles.
Renter Mobility
Of those who plan to purchase a car at some point, over 25 percent have an electric or hybrid vehicle in mind.
The National Apartment Association (NAA) surveyed more than 2,000 residents living in rental housing of all types at the end of 2017 to get their thoughts on car ownership and general mobility. About 35 percent of respondents were between the ages of 18 and 29, followed by 33 percent between 30 and 44 years of age. More than 52 percent described their residence as being in either an area that was urban or had an “urban feel,” with another 33 percent identifying as suburban dwellers. About 27 percent have one or more children under the age of 17 living in their households.
The majority, 75 percent, owned or leased at least one vehicle, only 5 percent being electric or hybrid. Of the respondents who do not own a car, 34 percent of them plan to never own one, followed by 26 percent who say it’ll be at least three years before they can purchase one. Of those who plan to purchase a car at some point, over 25 percent have an electric or hybrid vehicle in mind.
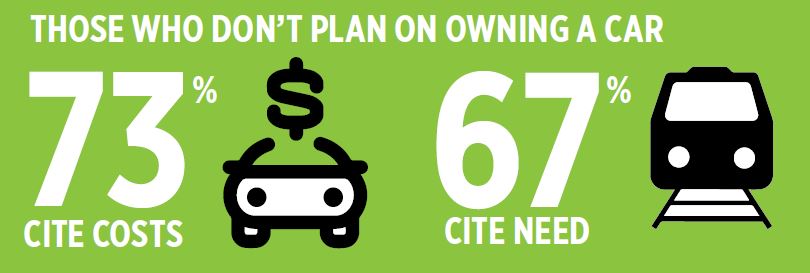
As expected, a majority of those (73 percent) who don’t plan to own a car cite costs as the strongest influence: Car payments, maintenance and insurance. But right on the heels of that reason (67 percent) is simply not needing or wanting one. Breaking this down by age group reveals that one in five renters between the ages of 18 and 34 expect to never own a car. Over half of the “never own” group describe their communities as “urban”, with nearly half living in New York, New Jersey, Connecticut or on the West Coast. Fifty percent walk to where they need to go five or more times a week; 24 percent use public transport at that same rate. Parking was available for 71 percent of respondents, over half of which was reserved parking. Seventy-one percent of residents report that there is no fee for these spaces, while about 15 percent report a fee of $100 or less per month. This is in line with NAA’s Survey of Income & Operating Expenses, which showed an average fee of $93 per unit with mid- and high-rise properties charging significantly more than garden-style properties.
Apartment communities that offer incentives to residents for using ride-hailing services such as Uber or Lyft are still relatively few, according to our survey. Just three percent live in communities that offer this, although another 20 percent report they are unsure whether this is available.
Unsurprising, given the extent of car ownership among the survey respondents, using one’s own vehicle is by far the most common means of getting around, with 70 percent reporting using it often (five or more times per week). The next most common way of getting from place to place is walking, at 26 percent. Although public transport handily beat out ride-hailing in terms of use reported as “often,” adding the regular use category (four or more times per month) moved it closer, 11 percent versus 19 for public transportation.
The Affordability Factor
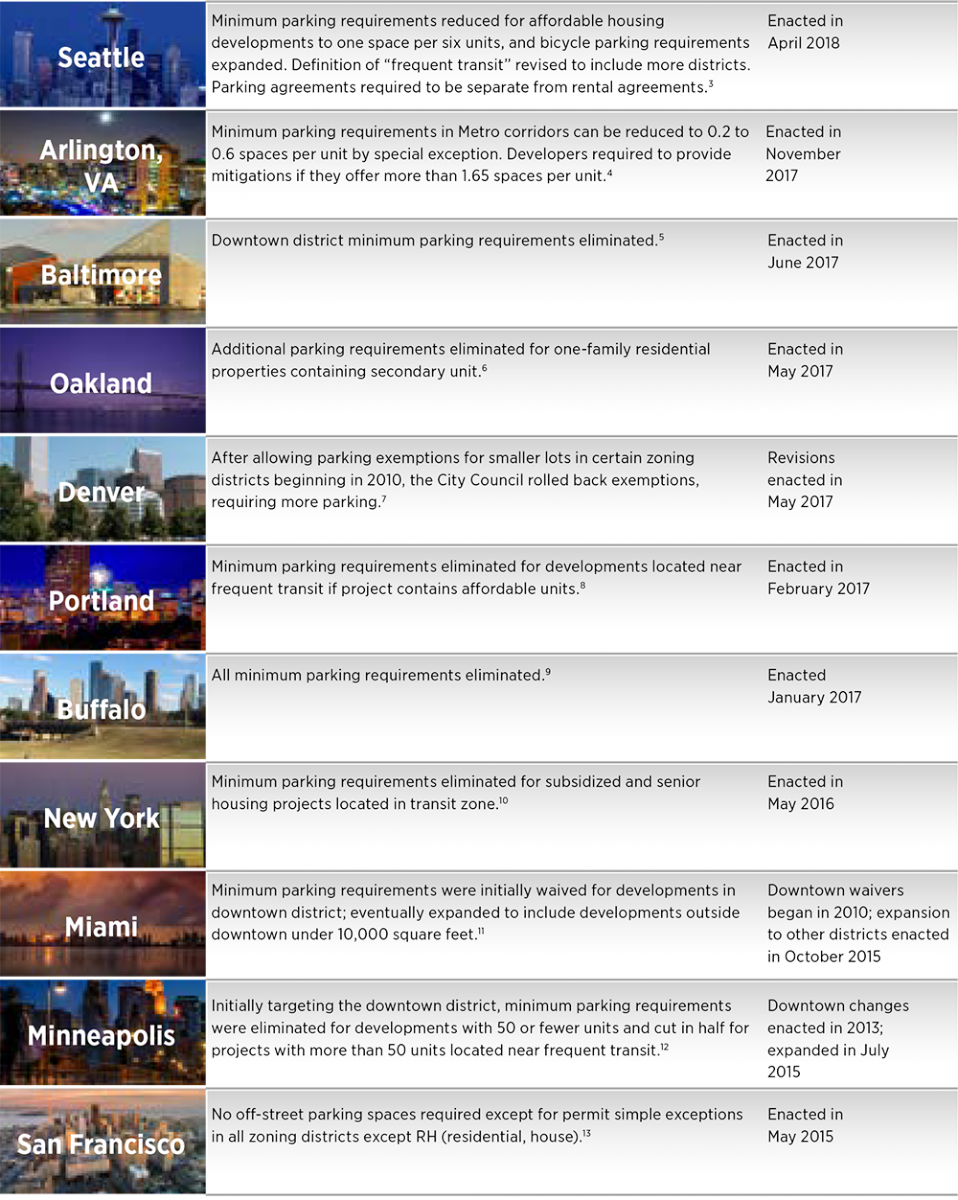
Few would argue that the cost of parking negatively affects housing affordability given both the cost to build a housing structure and the fact that local jurisdictions often mandate a minimum number of parking stalls. Estimated costs to build parking vary widely, but the Terner Center for Housing Innovation at the University of California, Berkeley estimates price tags of $30,000 to $75,000 per space, depending on the market.1 Type of parking also greatly influences the cost, with surface parking the least expensive, and underground parking the most.
An increasing number of cities have begun to reduce and even eliminate parking requirements for development. The chart below illustrates just a sample of the more recent changes to zoning codes in various municipalities across the country. In addition, cities such as Boston and Nashville are already building parking structures that can easily be converted to other uses.2
Strong Towns
Strong Towns, a 501(c)3 nonprofit media organization, created a map of cities that have reduced, or are considering reducing, parking minimums. Although the original map launched in 2015, it continues to be updated on a regular basis via crowd-sourcing. It’s important to note that these data are not independently verified, but many of the contributors are local planning or transportation officials or are affiliated with other “smart growth” organizations.
Looking Forward
Studies on myriad aspects of parking by a variety of stakeholders are abundant, and there is no shortage of predictions on its future. According to Green Street Advisors, parking needs will be cut in half over the next 30 years, to the tune of 75 billion square feet.14 RethinkX, an independent think tank, forecasts a decline in vehicle ownership from 247 million currently to 44 million by 2030, but makes a major assumption that autonomous vehicles will receive regulatory approval by 2020.15 Recent setbacks in autonomous vehicles’ progress, including accidents, make this assumption seem highly unlikely.
The architecture firm, Gensler, calculates a reduction in parking’s footprint from 25 percent for above and below-grade parking to up to 100 percent for surface parking16, that is, the potential to be completely eliminated; and also believes car ownership will peak in 2020 and decline thereafter.17
Gensler is already advising its clients to build parking that can easily be converted in the future. It comes at a cost, however, which is typically 15-20 percent higher. Design alterations include flat floor plates and higher floor-to-floor-heights, both of which lend themselves to conversions to several other use types.18
For the vast majority of apartment communities, removing parking altogether is clearly not an option at this point in time, as many residents own vehicles and lack of parking is a deal-breaker. Taking steps to move away from dependence on parking, however, makes sense given the trends already evident and likely to continue in the future. Perhaps more important in the near term is the ability of property owners and managers to provide their residents with access and support for multiple modes of transportation.
In the public and private sectors, more and more emphasis is being placed on managing demand rather than managing supply. The U.S. Department of Transportation defines demand management as “providing travelers with effective choices to improve travel reliability.”19 Products like TransitScreen®, which provide real-time arrival and departure times for subways, buses and commuter trains, are becoming more common in lobbies. Offering discounted transit passes and providing shuttles to transit stops also encourage public transit use.
Communities that are already offering incentives for ride-hailing may need to strengthen their marketing material, given that one in five survey respondents was unaware of whether this was available. Dedicated drop-off and pick-up locations are becoming more commonplace and make it easier for residents to use these services.
While walking topped biking among our survey respondents, offering bike storage and bike sharing have the added benefit of promoting wellness. Using Redfin’s WalkScore ® is an easy way to get a quick snapshot of walkability at the property-specific level.
Like any operations decision in the apartment industry, planning for parking’s future will be asset-driven and highly dependent on location. There is no “one size fits all,” but organizations that consider the complete transportation picture in all of its varied and emerging forms, as well as understand the value of flexibility, will have a clearer vision of one of many disruptors in the industry.
Download the Full Parking Survey Report
Sources
- The Resident Mobility Survey was conducted by NAA Research in late 2017 with 2,179 completions from residents in rental housing of all types across the U.S.
- Yardi Matrix: Historical data for parking ratios and parking types, 50+ unit market-rate properties
- CoStar: Historical data for car charging stations; average rents for selected metro areas, 50+ unit market-rate properties
- Enodo, Inc: Rent premium data for apartment properties in selected metro areas; 50+ unit market-rate properties
- U.S. Census Bureau, American Community Survey, 1-year estimates: Vehicle access by tenure and age
- Strong Towns: Crowd-sourced map of changes to minimum parking requirements across the U.S. Strong Towns is a national nonprofit media organization whose mission is to advocate for a model of development that allows America’s cities, towns and neighborhoods to grow financially strong and resilient.
Notes
- Graham McDonald, “The Effect of Local Government Policies on Housing Supply,” a study conducted for the Terner Center for Housing Innovation at UC Berkeley, May 2016
- Arcadis, Inc., HR&A Advisors, Inc., Sam Schwartz Consulting, LLC, “Driverless Future: A Policy Roadmap for City Leaders,” March 2017
- How Seattle’s New Law Would Change Parking Requirements
- Arlington County Reduces Parking Requirements for Multi-Family Developments on Metro Corridors
- A Map of Cities that Got Rid of Parking Minimums
- City of Oakland Library
- “Science Deniers” on City Council Drag Denver Backward By Requiring More Parking
- Parking Minimums Effectively Repealed In Portland – What’s Next?
- Buffalo Becomes First City to Bid Minimum Parking Goodbye
- Parking Requirements Will Be Reduced in a Huge Chunk of NYC
- Miami's Parking Deregulation Will Reduce Housing Costs
- Changes to Parking Requirements Made Big Impact on Minneapolis
- Divis Planning 101: Zoning Changes Explained
- Dave Bragg, Stephen Pazzano, “The Transportation Revolution: The Impact of Ride-Hailing and Driverless Vehicles on Real Estate,” Green Street Advisors’ presentation at Urban Land Institute Fall 2017 Conference.
- James Arbib, Tony Seba,“Rethinking Transportation 2020-2030,” report for RethinkX, May 2017
- Transitioning Building Design to a Future of Compact, Driverless Cars
- When car ownership fades, this parking garage will be ready for its next life
- The End Of Parking Lots As We Know Them: Designing For A Driverless Future
- Transportation Demand Management