
Executive Summary
The apartment market experienced a plunge in demand during the third quarter of 2022, as new household formation froze, and uncertainty increased in the face of ongoing inflationary pressure and concerns of another economic downturn.
As reported by RealPage, the occupancy rate for apartments dipped to 95.9%, the lowest point since Q1 2021. Effective rent increased nearly 13% year-over-year to $1,790. Looking at a quarter-to-quarter change, however, rent growth decelerated by 0.7 percentage points during the third quarter.
In September, wage growth dropped to 5% year-over-year, down 0.6 percentage points since March 2022. The leisure and hospitality sector continued to register the highest growth in wages, increasing nearly 8% since September 2021.
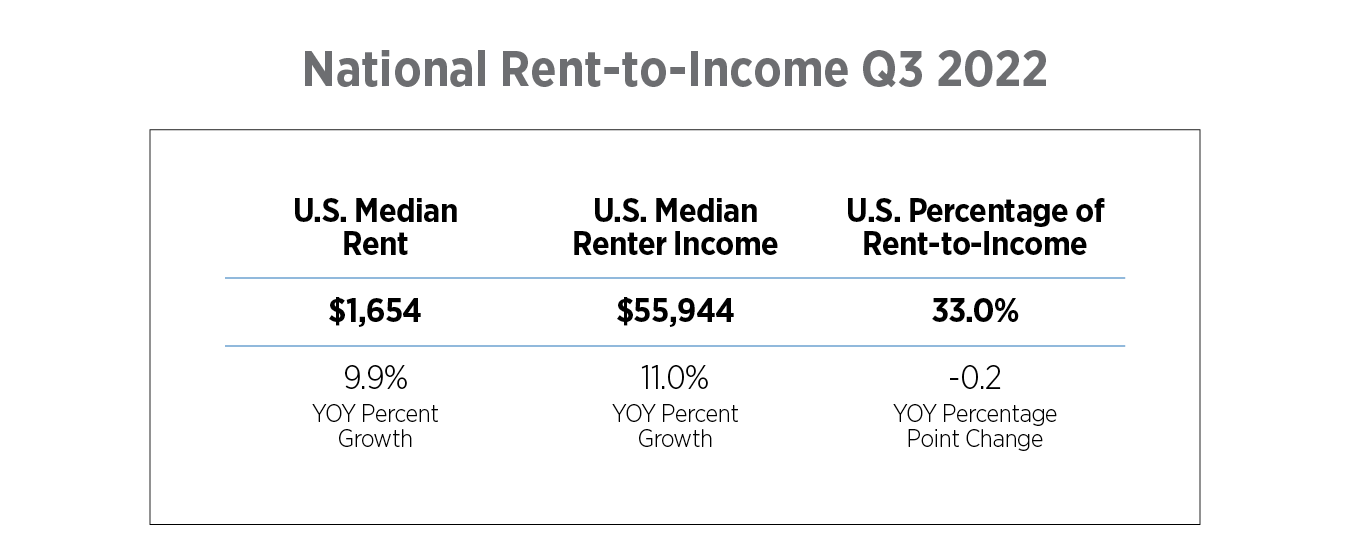
During Q3 2022, U.S. renter households in professionally managed properties spent on average 33.0% of their income on rent, down 0.2 percentage points since last year. Understandably, there was a broad variation in the share of income renters spent on rent at the market level. In this analysis, NAA explores the distribution of rent-to-income percentages across U.S. markets, focusing specifically on areas with the highest or lowest percentages.
Key findings:
- In the U.S., renters spent 33.0% of their income toward rent during Q3 2022, a slight decline of 0.2 percentage points since Q3 2021.
- The median income of renter applicants increased 11.0% year-over-year, outpacing median rent growth, which stood at 9.9%.
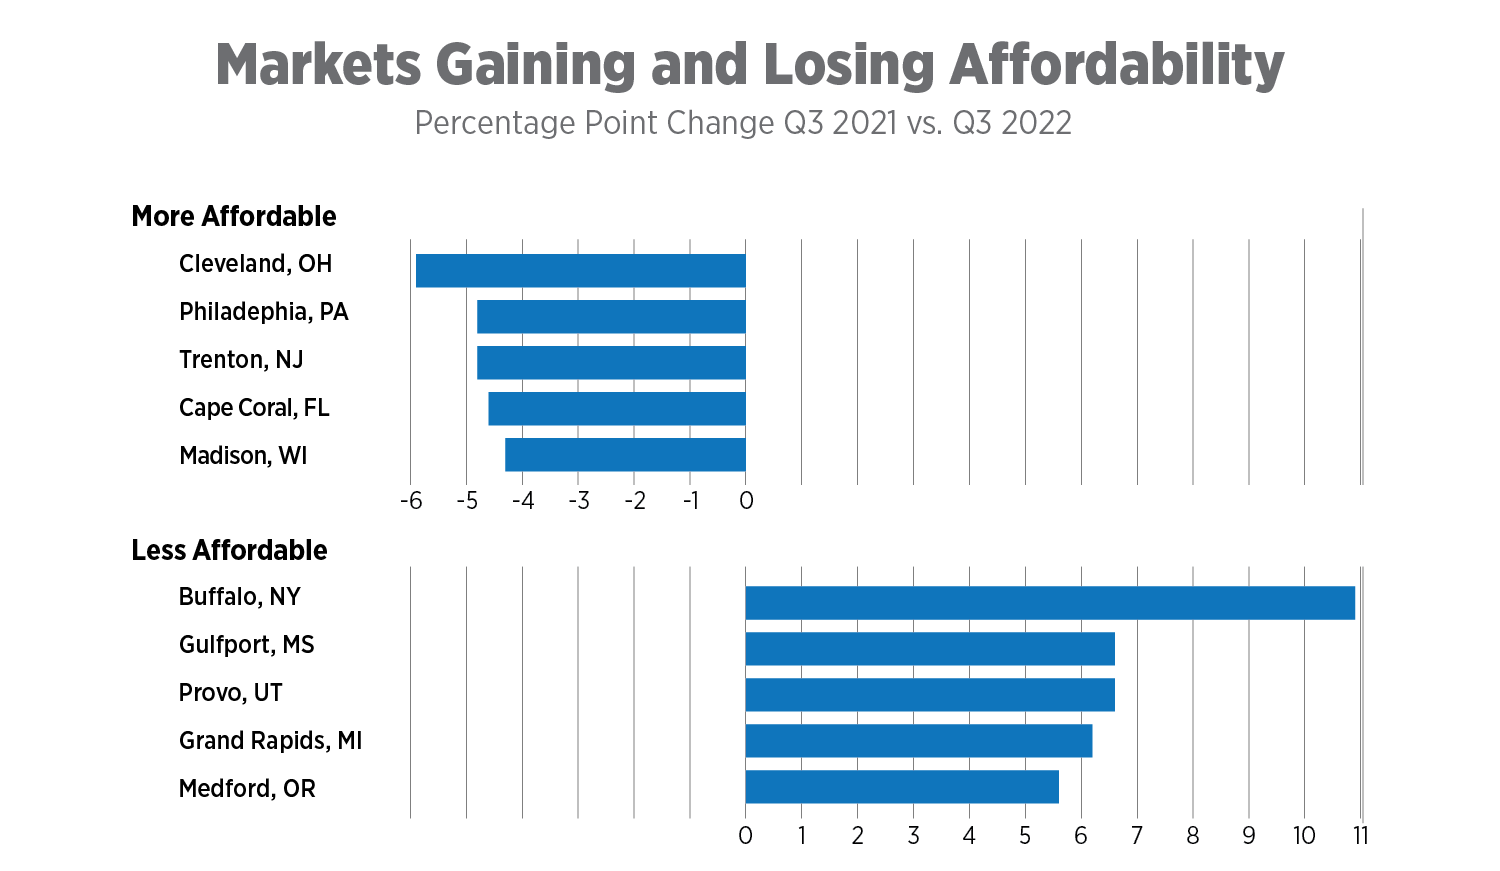
- The top five markets for improved apartment affordability since Q3 2021 are Cleveland; Philadelphia; Trenton, N.J.; Cape Coral, Fla.; and Madison, Wis Meanwhile, it was more of a challenge for renters to find affordable apartments in Buffalo, N.Y.; Gulfport, Miss.; Provo, Utah; Grand Rapids, Mich. and Medford, Ore.
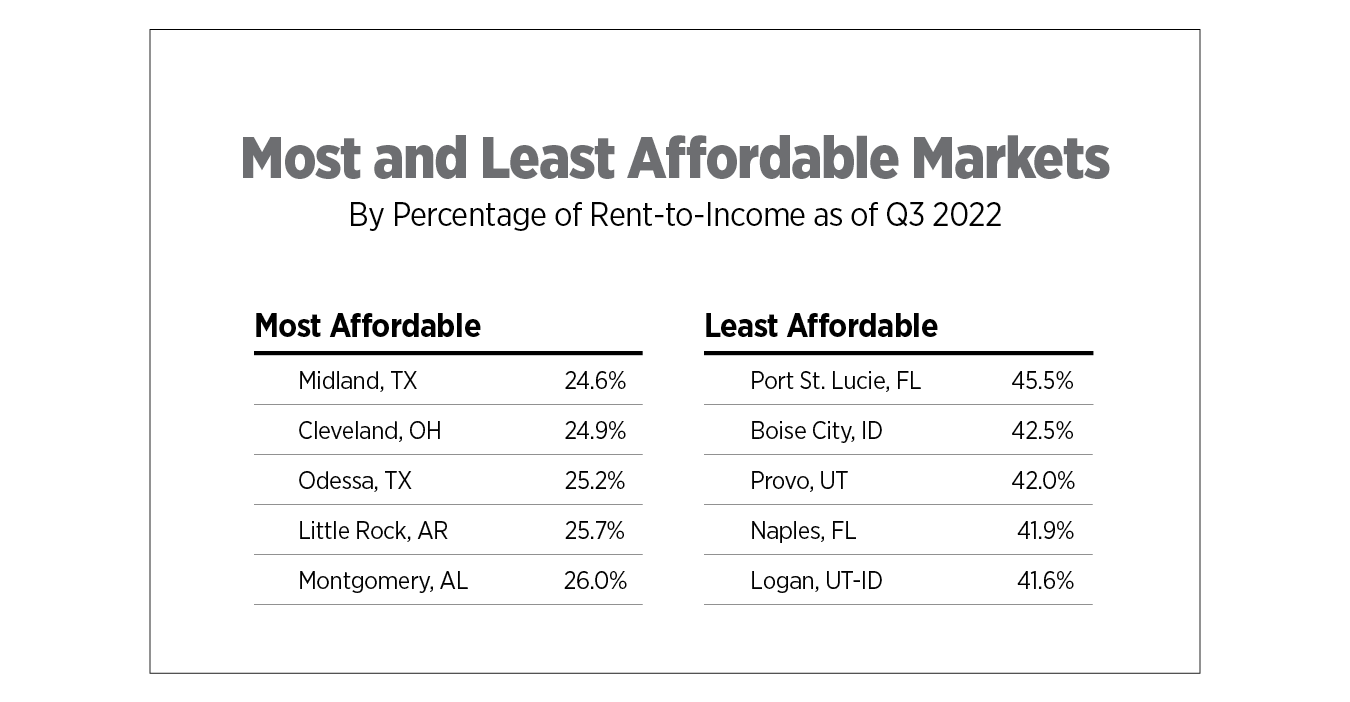
- Midland, Texas; Cleveland; Odessa, Texas; Little Rock, Ark.; and Montgomery, Ala. were the most affordable markets for renters in the third quarter, spending less than 27% of their income on rent. In contrast, renters living in Port St. Lucie, Fla.; Boise City, Idaho; Provo, Utah; Naples, Fla.; and Logan, Utah, spent more than 41% of their income on rent.
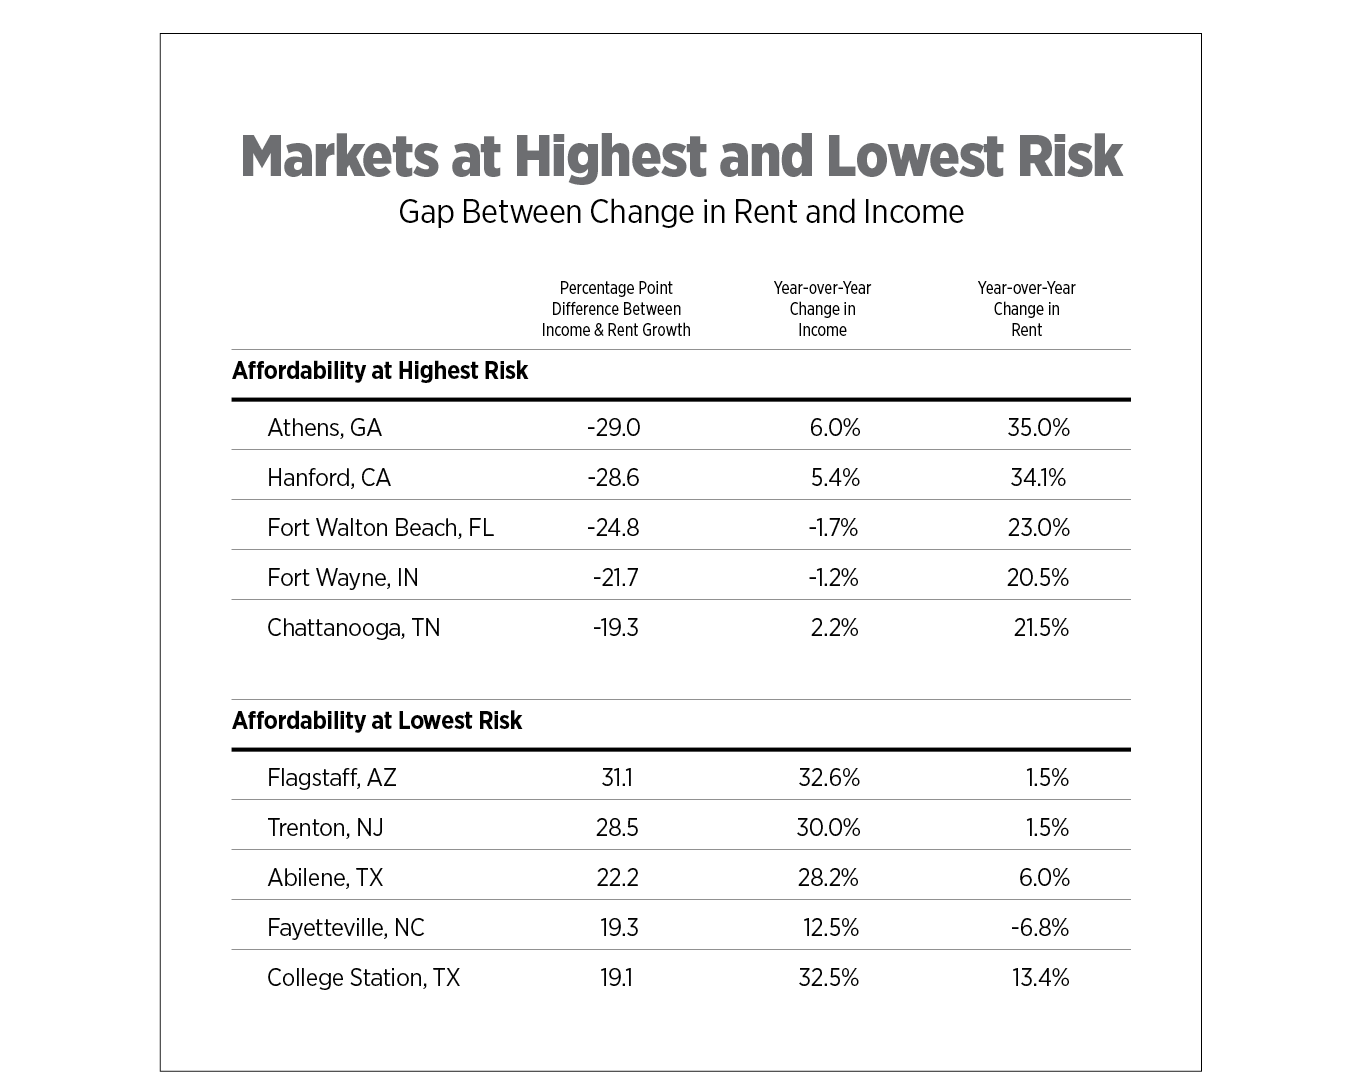
- Based on rental application data, the ability for renters to afford an apartment was at the highest risk in Athens, Ga.; Hanford, Calif.; Fort Walton Beach, Fla.; Fort Wayne, Ind.; and Chattanooga, Tenn., due to median rent growth outpacing median income growth. In contrast, income grew at a higher pace than rent in Flagstaff, Ariz.; Trenton; Abilene, Texas; Fayetteville, N.C.; and College Station, Texas.
How has apartment affordability changed since Q3 2021?
The improvement in rent-to-income ratios was most noticeable among renter applications in Cleveland. The Payscale Index tracks quarterly nominal changes in total cash compensation for full-time, private industry employees. The Q3 2022 report ranked Cleveland 10 out of 32 major markets for annual wage gains, with wages up by 5%. Cleveland has been a hotspot for job growth in health care, pharmaceutical and medical research industries.
The rent-to-income ratio in Buffalo, N.Y., was up nearly 11 percentage points year-over-year. The data further reveals that the median income of rental applicants was $47,520, as opposed to $55,100 in Q3 2021. The drop in the median income for renters looking for an apartment could be attributed to top earners migrating away from Buffalo. Apartment List’s quarterly Renter Migration Report found that Buffalo was among the top 10 metros experiencing high outbound searches to a different metro.
Where are apartments most and least affordable?
Midland, Texas, ranked as the most affordable apartment market based on the rent-to-income ratio. According to CoStar Group, effective rent was up by 15.5% year-over-year in Q3. At the same time, the median wages of renter applicants have also improved as employers boosted salaries to attract skilled employees. Montgomery was another market that ranked as the most affordable in the U.S. As reported by CoStar Group, asking rents averaged $950, roughly $200 less than nearby Birmingham, Ala., and Mobile, Ala. As of September, the unemployment rate in the Montgomery area stood at 3%, 0.3 percentage points lower than the national average. The automotive and manufacturing sectors have thrived in Montgomery, supporting strong job creation.
In contrast, Port St. Lucie was the least affordable market. Pandemic-driven migration trends have been a driving force behind the continued real estate boom in sunny Florida markets. The latest statistics showed that the average rent in Port St. Lucie grew at a rate much slower pace than in recent months, but still well above historical norms for this area of Florida. During Q3, year-over-year effective rent growth in Port St. Lucie stood at 5.2%, a significant decrease from the market's average of 12.4% during the past 12 months.
The quarterly Affordability Watch tracks rent-to-income percentages for over 100 metropolitan areas. Use the interactive map below to see apartment affordability trends for your local area.
Where is apartment affordability at highest and lowest risk?
The median rent for apartments in Athens has significantly increased over the past year, while median income levels among those applying for apartments have increased at a much slower pace. Like many markets around the country, rents increased at a slower rate than in previous quarters in Athens during Q3. Rent growth peaked during Q2 2022, increasing by 9.5% annually but moderated slightly to 8.4% during Q3. Rental demand from students attending the University of Georgia has been the key driver of apartment demand in Athens.
Renters in Flagstaff, Trenton and Abilene had the lowest risks of being rent burdened as the median incomes of renters applying for apartments grew faster than rent growth. Income gains far outpaced rent increases by more than 20 percentage points in these markets, which could reflect an increase in higher-wage renters applying for apartments. High rents and low vacancy rates have made it especially difficult for residents to find affordable housing in California . As a result, many renters have decided to pack up and move to nearby states and take their high wages with them as remote work is an option for many. Arizona markets have become a popular destination for renters moving from California looking for a change of scenery and a lower cost of living. According to data from Apartment List, Los Angeles provided 13% of apartment searches in Phoenix as of Q1 2022.
Note: Totals may not add up due to rounding
In Conclusion
The apartment market is slowing down as renters are concerned about inflation and an impending recession. Apartment fundamentals began to stagnate in Q2 2022 but significantly declined during the third quarter. This downward trend will likely persist because of the economic environment. National rent-to-income ratios have fallen by 0.2 percentage points since last year, which is not a significant change, but shows that there is some downward pressure on rent prices. Even as rent-to-income ratios have contracted at the national level, renters in 102 out of the 134 markets analyzed had rent-to-income ratios over 30%. The housing affordability crisis is a major challenge for renters, especially in markets with low vacancy rates and muted construction activity.