
U.S. Apartment Market
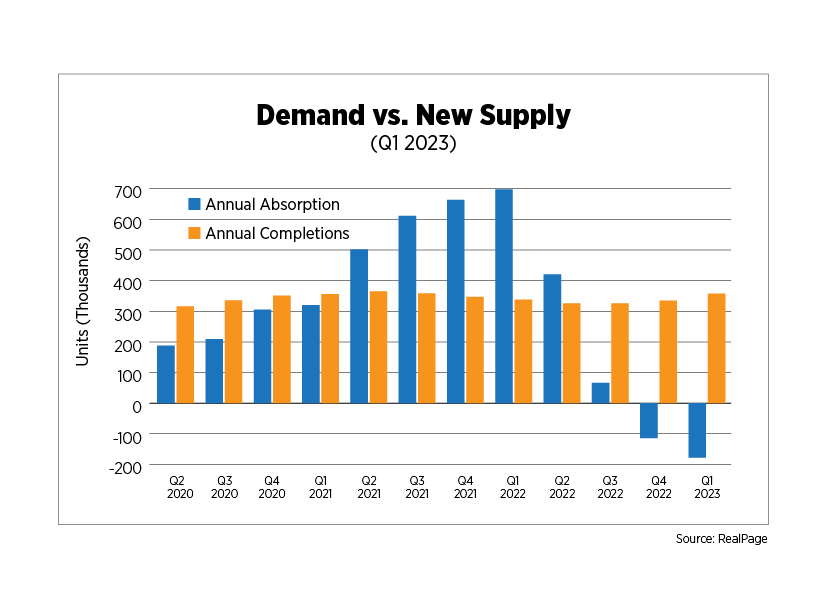
Apartment fundamentals were off to a sluggish start in 2023. While quarterly absorption was positive for the first time since Q1 2022, it fell far short of new completions. Monthly rent growth turned from flat to positive during the quarter but continued to decelerate on a year-over-year basis.
Annually, absorption remained negative at 177,000 units while completions rose to 358,000 units, according to data from RealPage. Occupancy slipped to 94.8%, its lowest level in six years and well off the 97.5% peak just one year ago. Seasonality may have returned to apartment market indicators as evidenced by slower winter months, although performance during the spring leasing season will prove or disprove that theory.
After four successive monthly declines, effective rent flattened in January and increased in both February and March. For Q1 overall, rents in professionally managed properties averaged $1,782 per unit, a 6.4% year-over-year increase. On an annual basis, rent growth has decelerated for four quarters, and with new supply still outpacing absorption, can be expected to decelerate further next quarter unless an unexpected surge in demand occurs.
At the metro level, only four of the 79 markets tracked by Moody's/REIS experienced year-over-year effective rent declines: Little Rock, Ark.; Tulsa, Okla.; Memphis, Tenn.; and Wichita, Kan. Ten markets continued to have double-digit rent growth with the top five being Buffalo, N.Y.; Knoxville, Tenn.; Charleston, S.C.; Seattle and Tacoma, Wash. A quarterly analysis paints a far different picture, however, that is one of muted demand unable to keep up with new supply in many markets. Rents fell from last quarter in 60 markets. Fairfield County, Conn.; Louisville, Ky.; Greensboro/Winston-Salem, N.C.; Syracuse, N.Y.; and Raleigh-Durham, N.C., were at the bottom and saw rents dip by 2.8% to 6.4% in a matter of three months.
Vacancy rates were up in 37 markets from Q4 2022, about the same number compared with Q1 2022. Unsurprisingly, cities that have experienced outsized construction activity such as Nashville, Tenn., Minneapolis and Orlando, Fla., are among those with the greatest increases in vacancy rates.

Permitting activity has begun to moderate, with an average of 558,000 seasonally adjusted annual units authorized in Q1, compared to the post-pandemic peak of 710,000 in Q4 2021. Quarterly completions were at their highest point since 1987 with 452,000 units (seasonally adjusted annual rate) delivered during the quarter. The number of permits authorized but not started hit another record high in February, as fallout from high interest rates, elevated inflation and economic uncertainty persisted.
U.S. Capital Markets
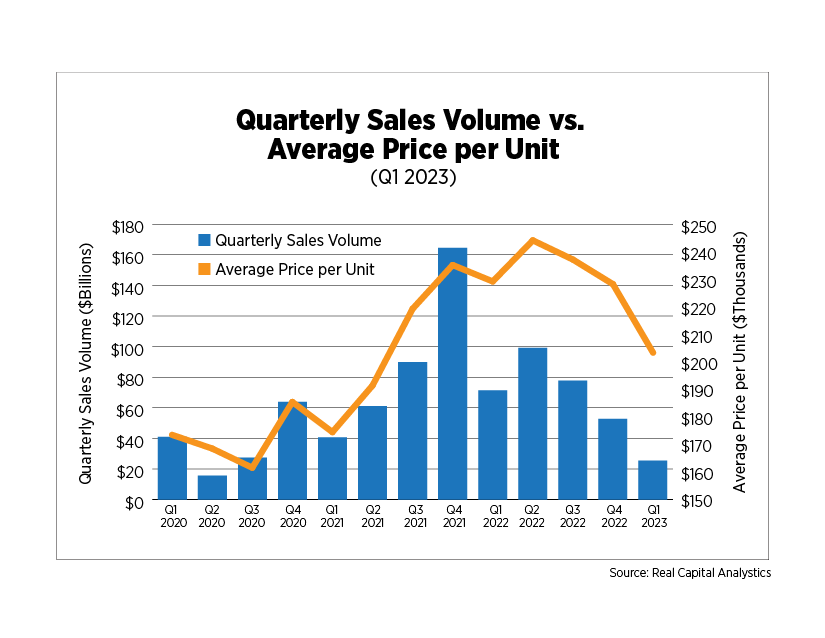
At just $25.4 billion, transaction volume was at its lowest point since Q1 2014, apart from the pandemic. Record levels of activity in 2021 and into 2022 make year-over-year comparisons somewhat hollow, but focusing on Q1 activity shows volumes that are well within long-term norms. Additionally, total transactions for the 12 months ending March 31 remained highly elevated compared to levels seen last decade. Still, the rise in interest rates has quelled activity as both buyers and sellers are forced to readjust pricing and value expectations. This process will not happen overnight so we can expect activity to remain subdued, at least in the short term.
The average price per unit has declined for three consecutive quarters and was down 11.4% year-over-year. Prices for garden-style properties were down 12.7% while mid- and high-rise properties dropped 7.6%. Cap rates have risen to an average of 5.1%. The spread between garden and mid-/high-rise cap rates, which was over 100 basis points in 2013 and 2014, has now been depleted. Cap rates are expected to expand further, surpassing mortgage rates and resulting in fewer negative leverage transactions.
Real Capital Analytics' Commercial Property Price Index fell 9.6% for the six major metros it tracks and 5.2% for non-major metros. The top deals for the quarter, in terms of dollar volume, were dominated by Southeastern markets, where half of the top 10 transactions took place.
Cross-border buyers returned to the U.S. market in Q1, a signal of confidence for multifamily assets, comprising 9.1% of transactions after averaging 3.2% in 2022. REITs were hefty sellers of assets during the second half of last year, but that abated in Q1, comprising just 2.2% of volume sold, largely in line with pre-pandemic percentages.
U.S. Build-to-Rent Market
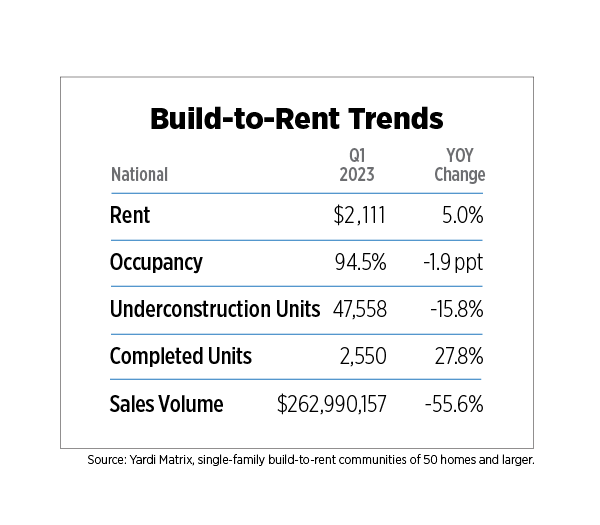
Rents in single-family build-to-rent (BTR) communities with 50 or more units may be peaking on a quarterly basis, with the average effective rent of $2,111 unchanged from last quarter, but up 5.0% year-over-year. More markets were still experiencing annual rent increases than decreases, according to Yardi Matrix, with Nashville, Chicago, Baltimore and Portland, Ore., growing in the double-digits as of April, while Atlanta and Orlando have seen rents drop by 10% or more during the past year.
Occupancy rates were off from their 2021 recovery peak (97.0% in Q3 2021) when household formation was surging and have dropped 250 basis points to 94.5%. New units were still being delivered at a steady clip with more than 2,500 coming on line in Q1, well above pre-pandemic norms. Of the larger BTR metro areas (home to at least 1,000 units), Nashville, Charlotte, N.C., and Fort Worth, Texas, grew at the fastest pace, churning out 10% or more of the existing stock in Q1 alone.
U.S. Economy
Despite the strongest labor market in recent history, inflation cooling and the Fed winding down its monetary policy tightening, uncertainty pervades the psyches of both businesses and consumers. The University of Michigan’s Consumer Sentiment Index and the National Federation for Independent Business's Small Business Optimism Index remained at levels coincident with economic downturns and, in fact, below the readings seen in the spring of 2020 when the economy shut down.
The Small Business Optimism Index just closed the 16th straight month at levels below the near-50-year average of 98. Only 3% of small businesses surveyed think now is a good time to expand. Of those who do not, 34% cited economic conditions while another 10% blamed the political climate. About 55% said there were few or no job candidates for positions they have open, down from a peak of 62% in September 2021, yet highly elevated. A net 17% still plan to hire within the next six months (down from 32% in 2021). The average interest rate paid for a short-term loan swelled to 8.5% and certainly played into responses related to planned capital expenditures. Only 19% are planning a capital expenditure within the next three to six months, a new post-pandemic low and a signal of slowdown in economic activity ahead.
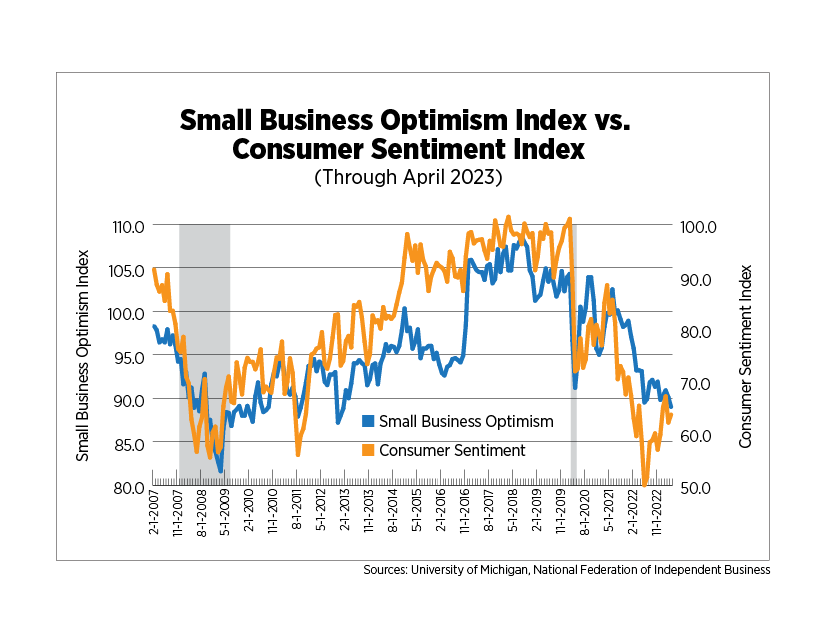
The preliminary May estimate for the Consumer Sentiment Index showed it plunged by nearly six points, with the consumer expectations component dropping by more than seven points. The recent bank failures and the looming debt ceiling debate are souring expectations even further. Long-run inflation expectations are now at their highest points since 2011, indicating that consumers are losing confidence that any economic contraction which might occur will be short-lived.
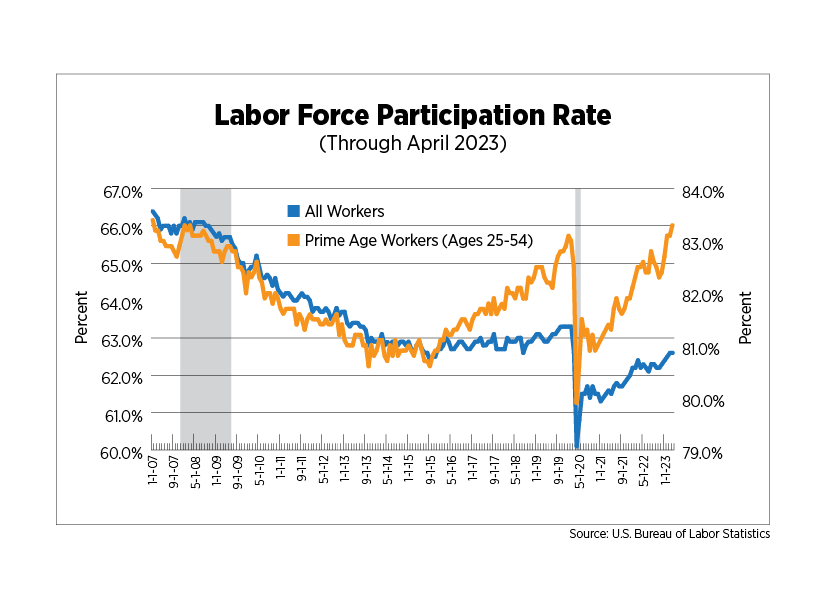
Increased layoff announcements and a decline in the number of job openings have not been enough to offset job growth or the unemployment rate. Through April, an average of 285,000 jobs were added per month while the unemployment rate remained at 54-year lows. One of the most compelling indicators of labor market conditions is the labor force participation rate, the ratio of the number of people working or looking for work compared to population. While the overall rate is struggling to return to pre-2020 levels thanks in large part to retirements, the ratio for employees in their prime working years (ages 25-54) has soared back to the rate witnessed prior to the Great Recession and is nearing that seen during the second-longest economic expansion, which began in the 1990s.
Outlook
The self-fulfilling prophecy of recession may well occur in the coming months if businesses and consumers follow their sentiments - decidedly not a guarantee. There are far more downside risks to the economy than upside and any of one of them could tip the economy into recession: More bank failures, sustained financial market volatility, the U.S. defaulting on its debt, businesses putting the break on spending and hiring - and those are only the domestic issues. If inflation continues to slow, interest rates at least level off and a deal on the debt ceiling is made, consumer sentiment may finally show some signs of steady improvement.
Several factors seem set to converge to keep apartment demand supported, even if it comes at more normal measures. The inventory in the for-sale home market remains extremely tight. Very small declines in the 30-year fixed rate mortgage rate have been resulting in a bump in sales, but there simply are not enough homes to go around to everyone who wants to buy one. Apartment supply is expected to peak over the next two years, although financial conditions and economic uncertainty may prolong the process a bit. This will provide plenty of choices for those who are forming new households and will very likely come at a time that may well be described as a renters' market.