
To assess rental housing affordability at the market level, the National Apartment Association (NAA) analyzed rent-to-income percentages, which are based on residential lease applicants from professionally managed properties screened by TransUnion’s Resident Screening platform for Q4 2021 and Q4 2022.
Executive Summary
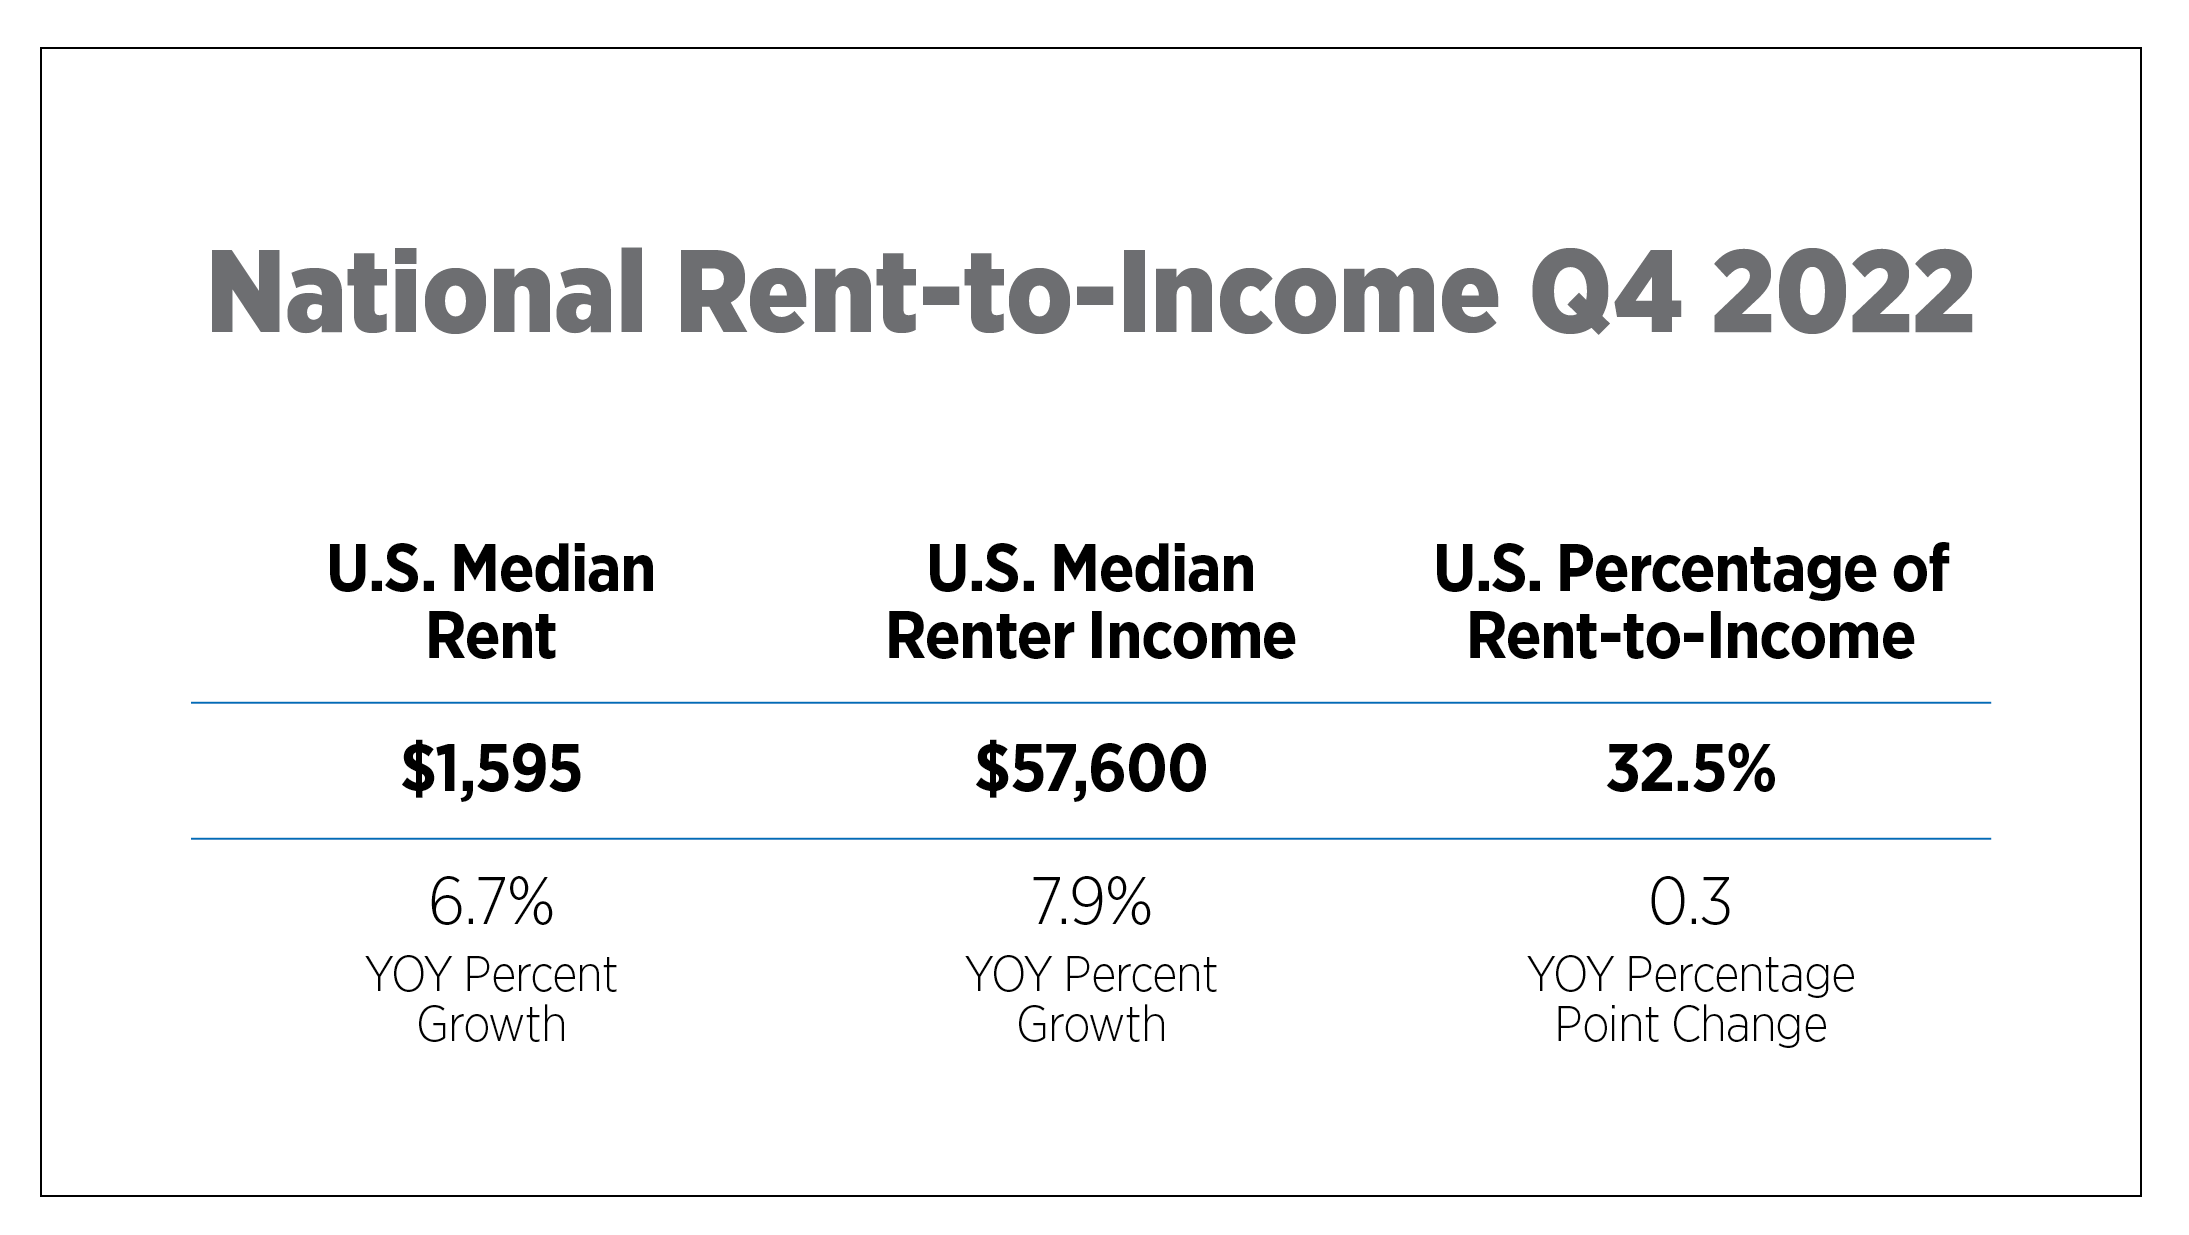
In the fourth quarter of 2022, U.S. renter households in professionally managed properties spent an average of 32.5% of their income on rent, up slightly from the year prior. Apartment market fundamentals continued to shrink, resulting from economic uncertainty that left many households and businesses in limbo. RealPage data indicates that Q4 2022 was a landmark period for apartment market fundamentals. Net absorption was negative for the first time since 2008's Great Recession, resulting in occupancy rates falling 230 basis points year-over-year. Despite demand decelerating, annual rent growth recorded a healthy rate of 8.9%, although declining slightly by 0.6% since the previous quarter.
As rents maintain moderate growth and wage growth cools somewhat, apartment affordability has become an increasingly crucial issue for renters, housing providers and policymakers. Rent-to-income ratios provide an important way to measure housing affordability as they capture both inputs into the household finance equation - income of renters and cost of renting apartments. By looking at this ratio across markets over time, a better understanding of the affordability dynamics affecting renters across the country can be gained. It’s important to note that these ratios are based on rent and income data from actual lease applications in the TransUnion data set and may vary from other private sector or government data sources.
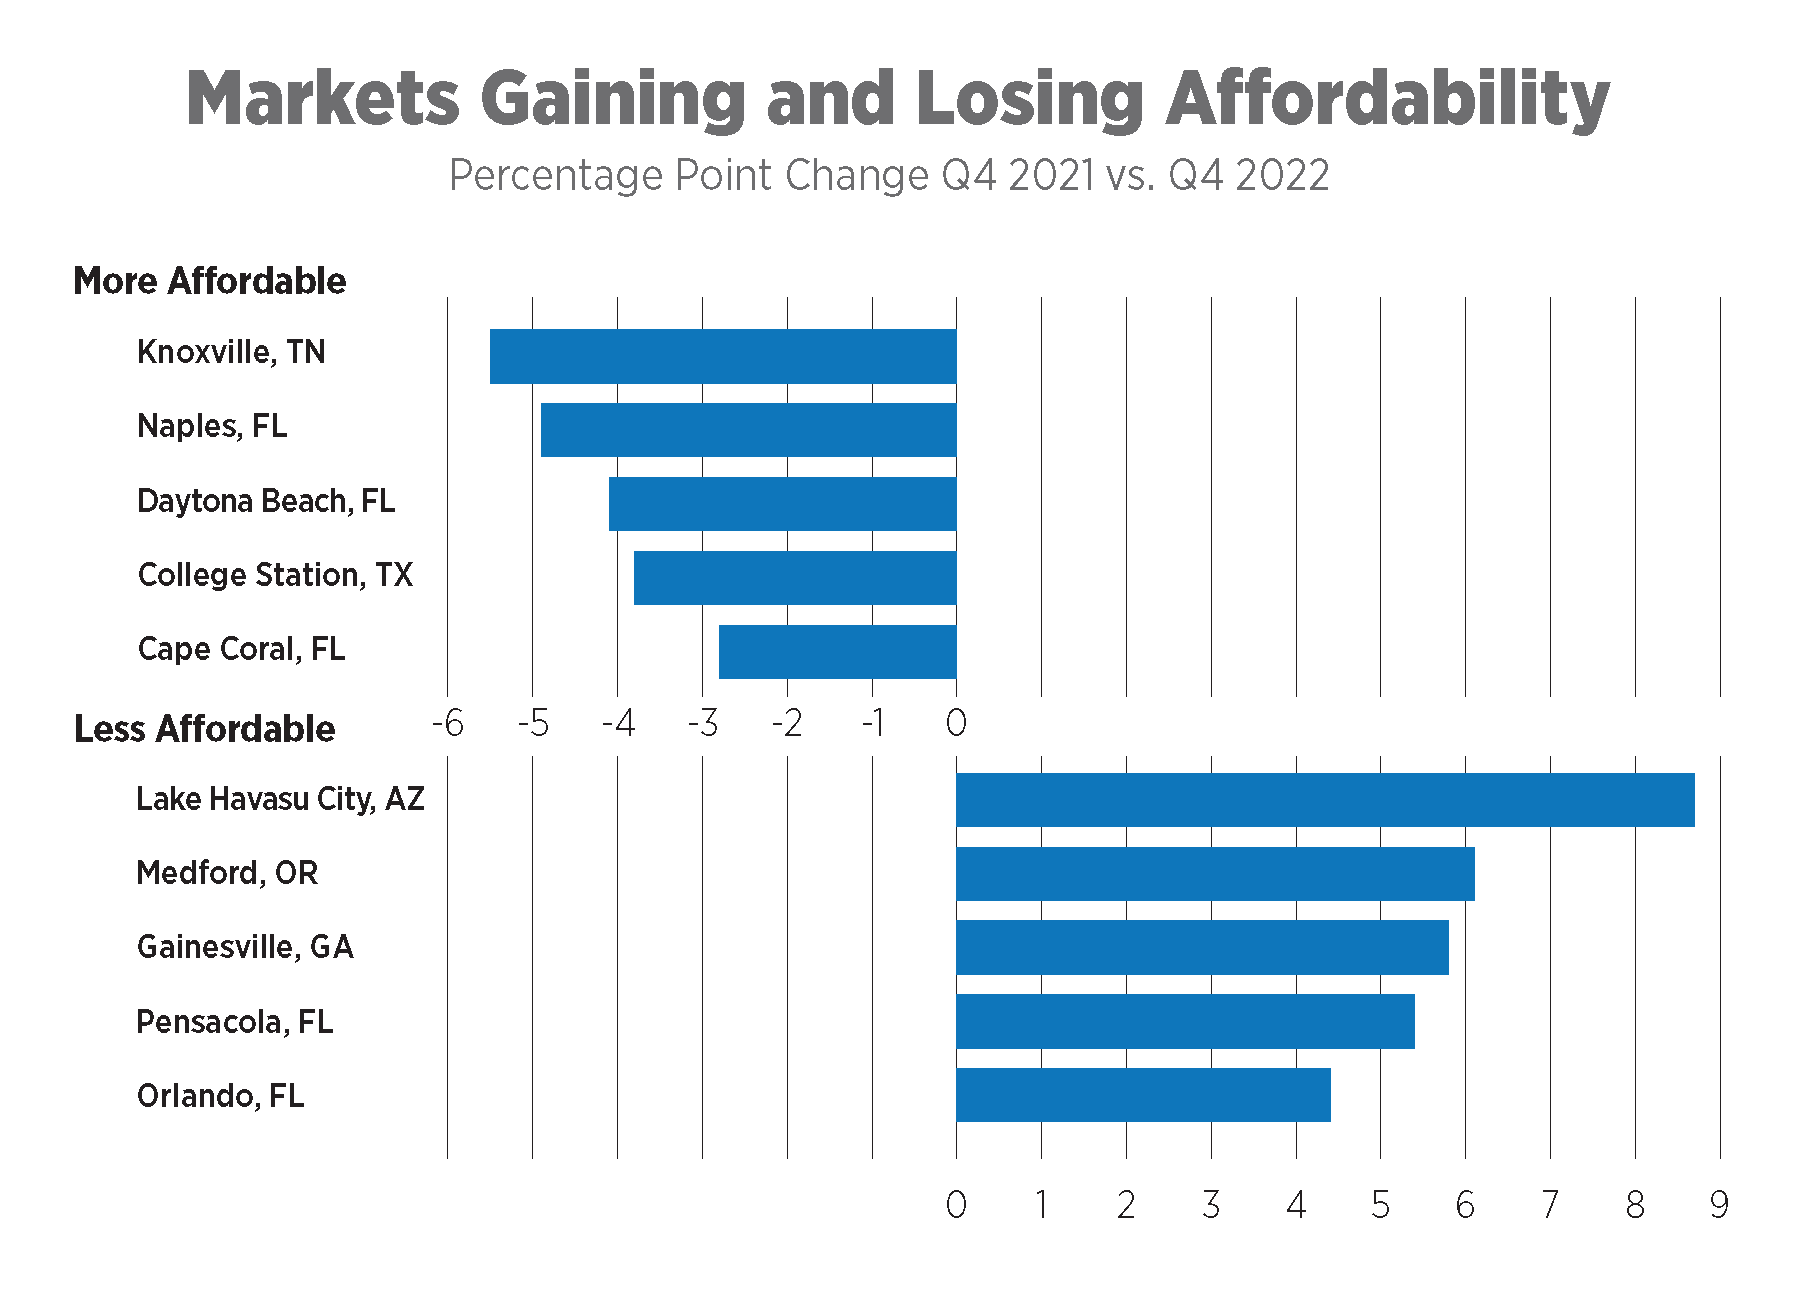
How has apartment affordability changed since Q4 2021?
Knoxville saw the most improvement in apartment affordability year-over-year thanks to median incomes of applicants increasing. According to rental applications screened by TransUnion, the annual median income for Knoxville renters rose from $32,700 in Q4 2021 to $48,000 in Q4 2022. As a result of this increase in median income, the rent-to-income ratio improved by 5.5 percentage points to 31.9%. Knoxville’s economy is diverse, with major employers in industries such as education, healthcare and manufacturing. The Oak Ridge National Laboratory of the U.S. Department of Energy is the largest employer in the metro with 13,000 employees. The city is home to the University of Tennessee, which provides jobs for 10,000 residents. Additionally, Knoxville employs about 25,000 people across more than 10 major hospitals throughout the metro.
Meanwhile, Lake Havasu City renters may be feeling the pinch of housing affordability. Located between Las Vegas and Phoenix, the city has experienced a growth spurt in recent years. The median rental rate for an apartment was $755 in Q4 2021. However, by Q4 2022, median rent had increased to $965, representing a 27.8% increase in just one year. Simultaneously, the median income dropped slightly from $35,800 in Q4 2021 to just over $34,600 in Q4 2022. This resulted in an 8.7 percentage point hike to rent-to-income ratios illustrating that apartment affordability is more out of reach.
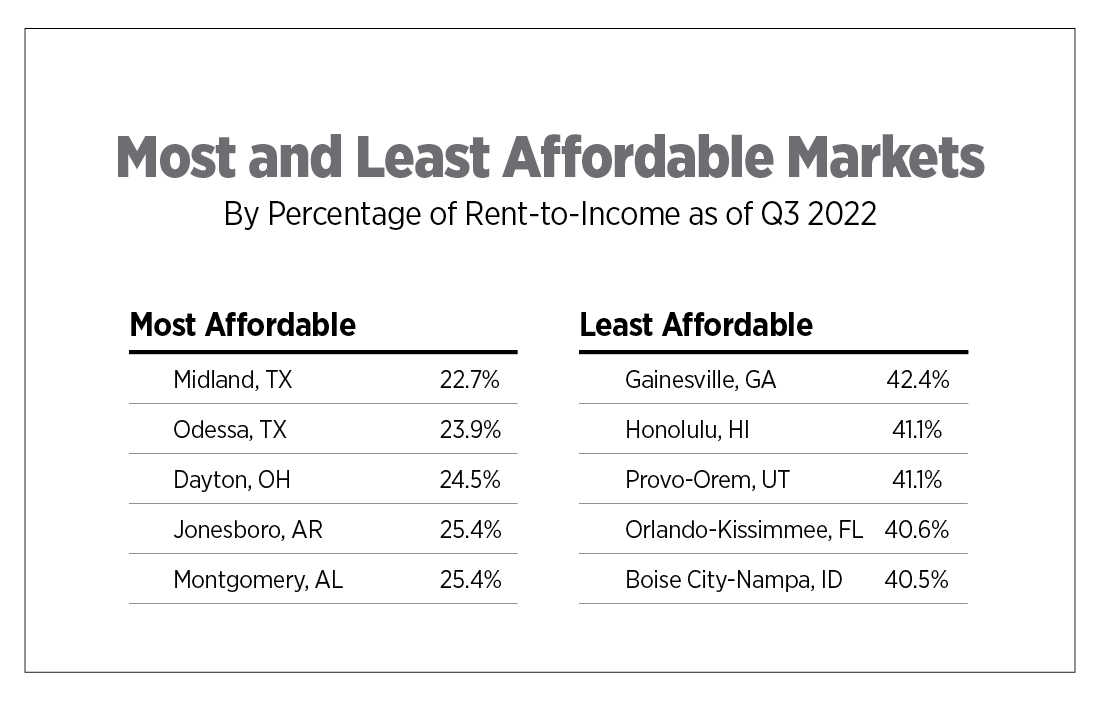
Where are apartments most and least affordable?
For four consecutive quarters, Midland has held a place among the top five most affordable markets for apartment living. This market is a hotspot for talent, equipped with a highly educated and skilled workforce. Kenan Institute's American Growth Project predicts that Midland will be the fastest-growing economy among the 100 largest mid-size cities in the U.S. for 2023. Furthermore, Midland’s economy is projected to grow twice as fast as San Francisco, which the Kenan Institute ranked as the top market for economic growth in 2023 among the 50 largest cities.
In Q4 2022, Gainesville presented a challenging apartment market for prospective renters, as the discrepancy between income and rent was significant. With median incomes of $48,000, applicants for this market were expected to put 42.4% toward renting an apartment each month.
Provo is home to a growing tech industry and highly educated workforce and has consistently ranked among the least affordable apartment markets in 2022. This market has experienced high housing demand, which can largely be attributed to tech employees who can afford homeownership. Meanwhile, with an abundance of students from Brigham Young University and Utah Valley University seeking off-campus housing, there has been a surge in apartment construction around the two universities. This population is primarily made up of 20–34-year-old renters with limited student incomes. Affordable apartment options proved hard to come by for many applicants, who had median incomes of $38,400 and sought out apartments with rents around $1,580 per month.
The quarterly Affordability Watch tracks rent-to-income percentages for 99 metropolitan areas. Use the interactive map below to see apartment affordability trends for your local area.
Where is apartment affordability at highest and lowest risk?
Huntsville's strong job growth and rising single-family home prices continue to drive steady growth in the apartment market. According to CoStar Group, Huntsville has posted 13 consecutive quarters of positive absorption. Prospective renters in Huntsville experienced rental rates that severely outpaced income growth by 33 percentage points, making this area the most vulnerable when it comes to apartment affordability.
Renters in Knoxville had the lowest risks of being rent burdened, as the median incomes of renters applying for apartments grew faster than rent growth. Income growth outperformed rent growth by nearly 26 percentage points. Tennessee has seen significant job growth during the past year, with 123,200 jobs added to payrolls statewide. Leisure and hospitality led to this expansion closely followed by trade, transportation and utilities sectors.
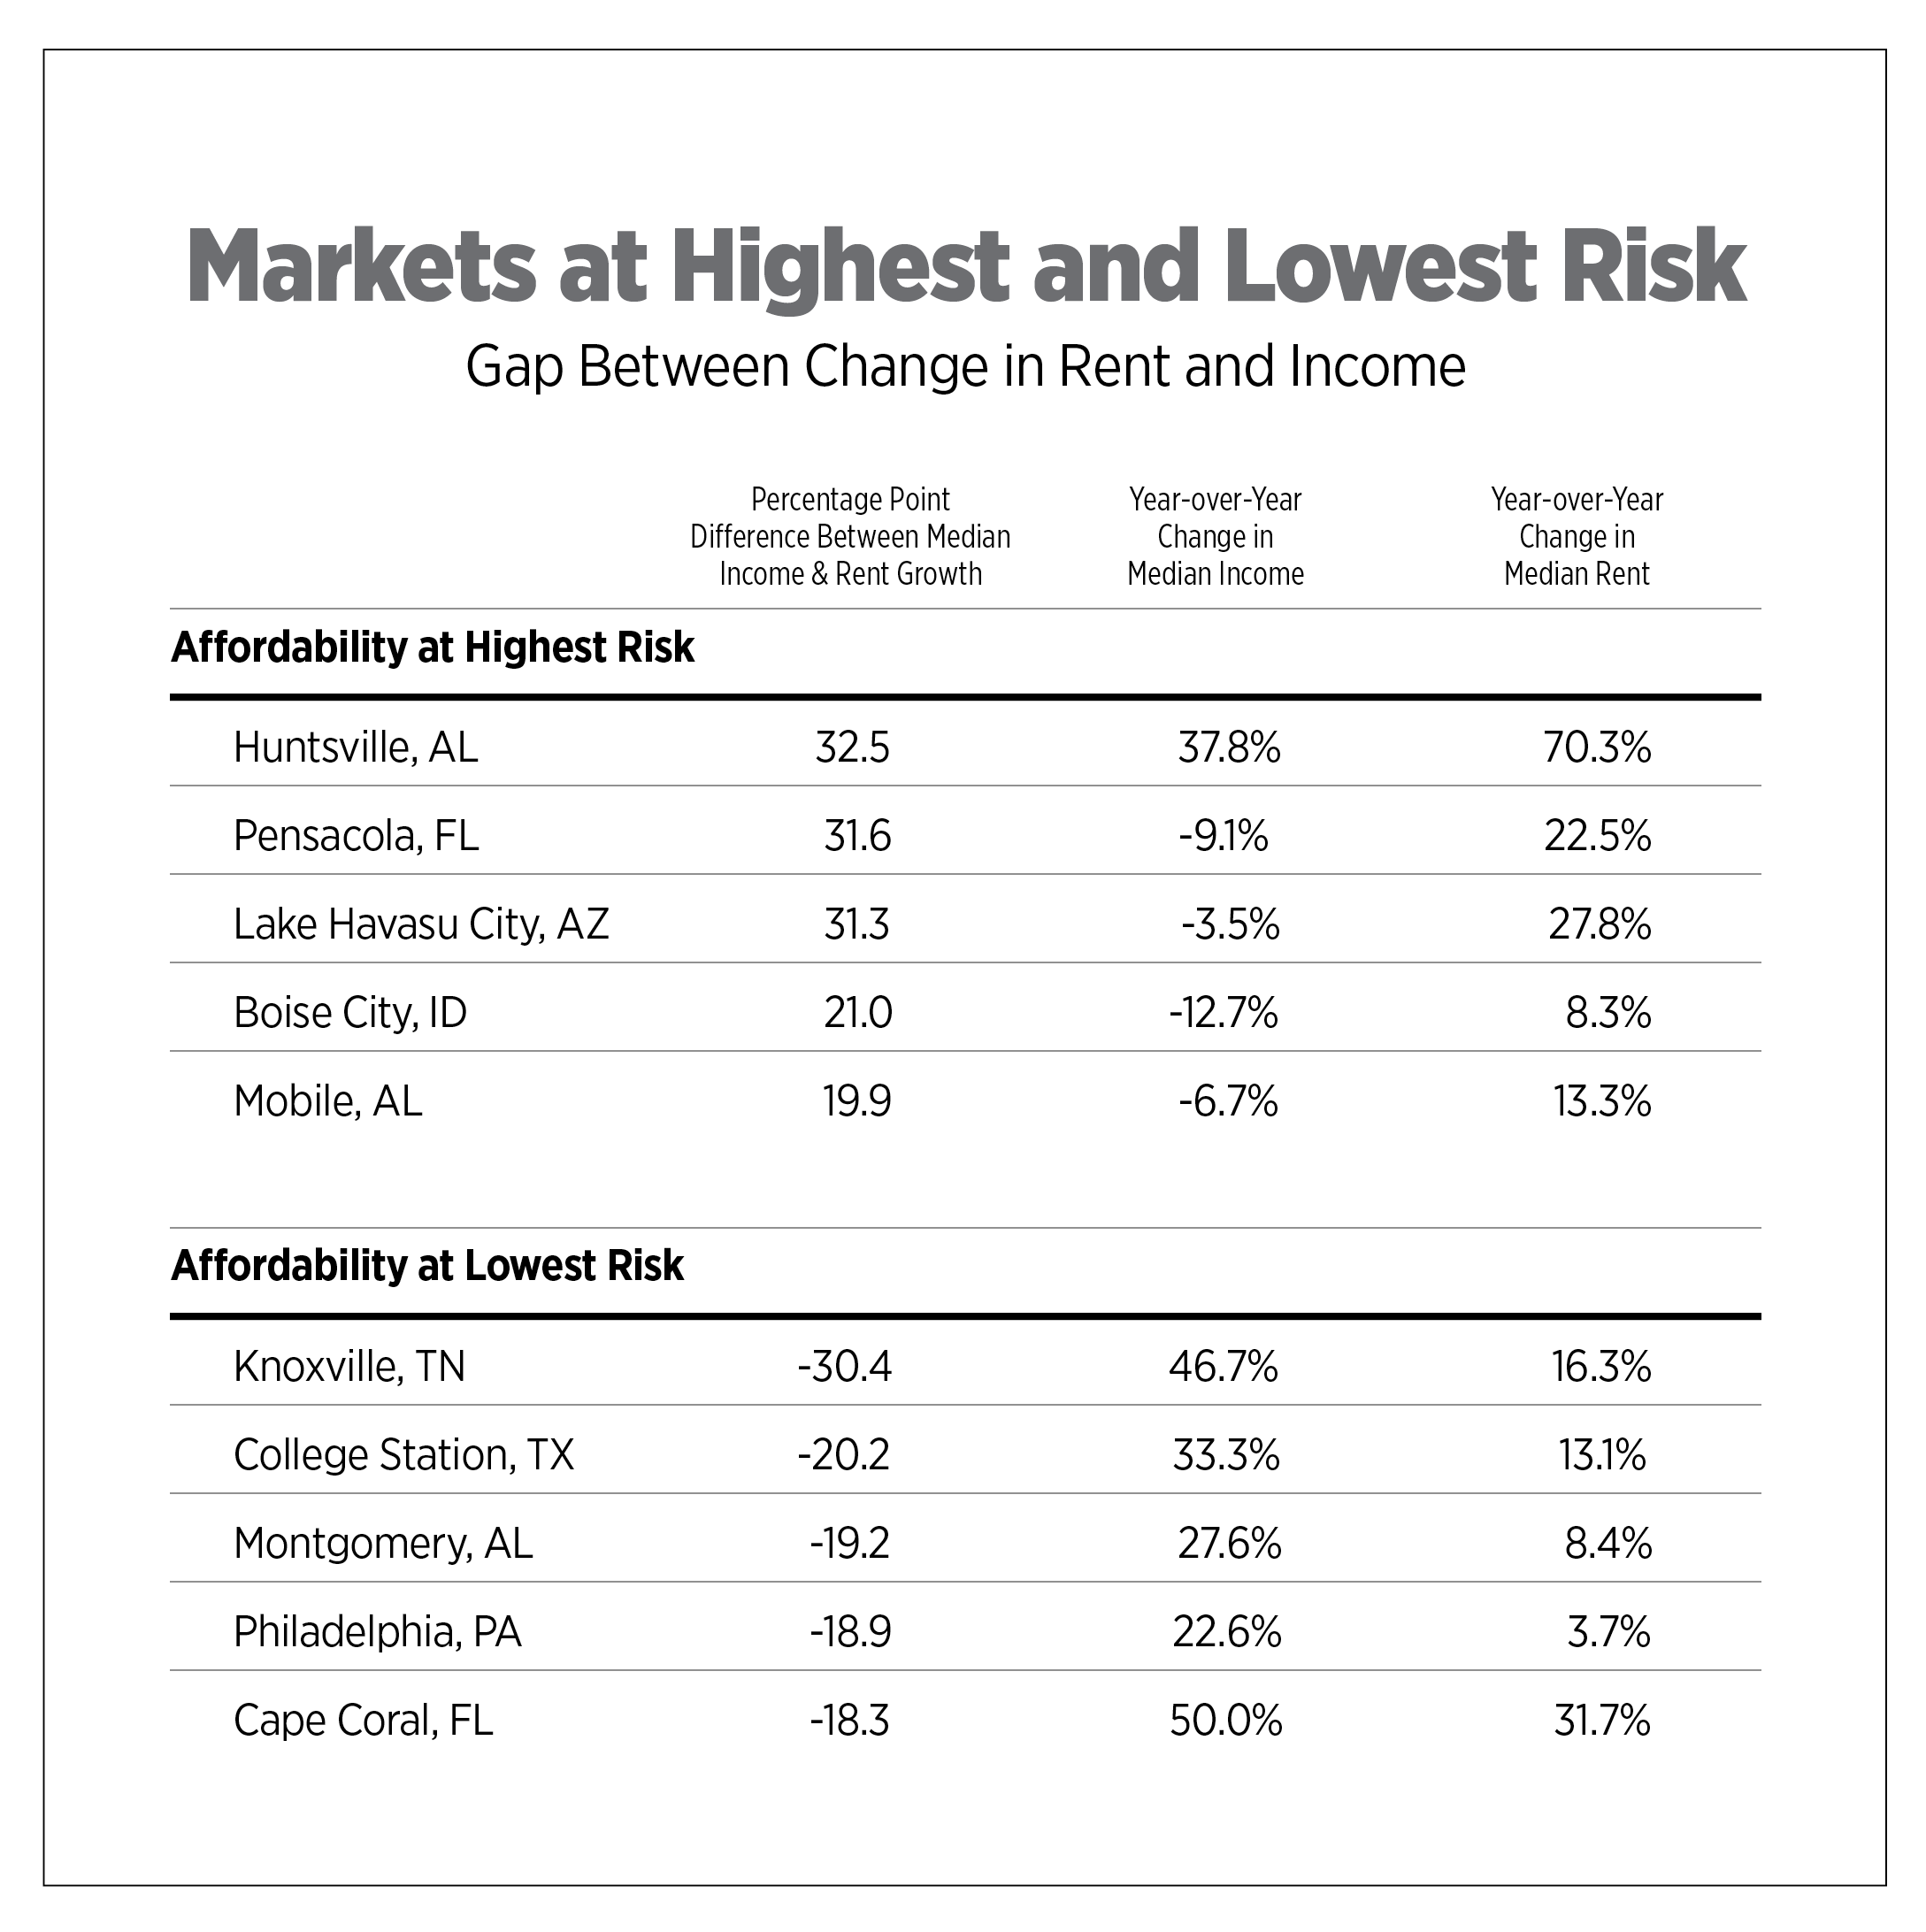
Note: Totals may not add up due to rounding
In Conclusion
The end of the year marked a record-low decrease in rental demand, rooted mainly in economic unease and conservative spending habits of would-be renters. Although apartment market fundamentals softened, 78 out of 99 markets reported having rent-to-income ratios of more than 30%. It’s evident that affordable housing is still a daunting challenge for those looking to enter or remain in the market. Unfortunately, in an effort to prioritize speed over efficacy some policymakers are turning toward rent-control measures as a solution. However, it has been proven rent control can ultimately hinder investment and development opportunities within the housing market, thus worsening apartment affordability. Instead, to tackle the housing crisis, policymakers must support credible and proven solutions such as reducing barriers to new construction, increasing investments in vouchers and program administration of the Section 8 Housing Choice Voucher Program and expanding tax policies that perverse and encourages multifamily investments. These solutions will provide suitable resources to build and maintain affordable homes for renters of all income levels.
Notes:
1. Rent-to-income averages are based on approved residential lease applicants screened by TransUnion’s ResidentScreening platform in Q4 2021 and Q4 2022.
2. Market level analysis was conducted for 99 markets which received over 100 applications.
Sources: NAA Research; TransUnion Rental Screening Solutions; RealPage; U.S. Bureau of Labor Statistics; Costar Group; Kenan Institute