CPI, Latest Release, March 2022
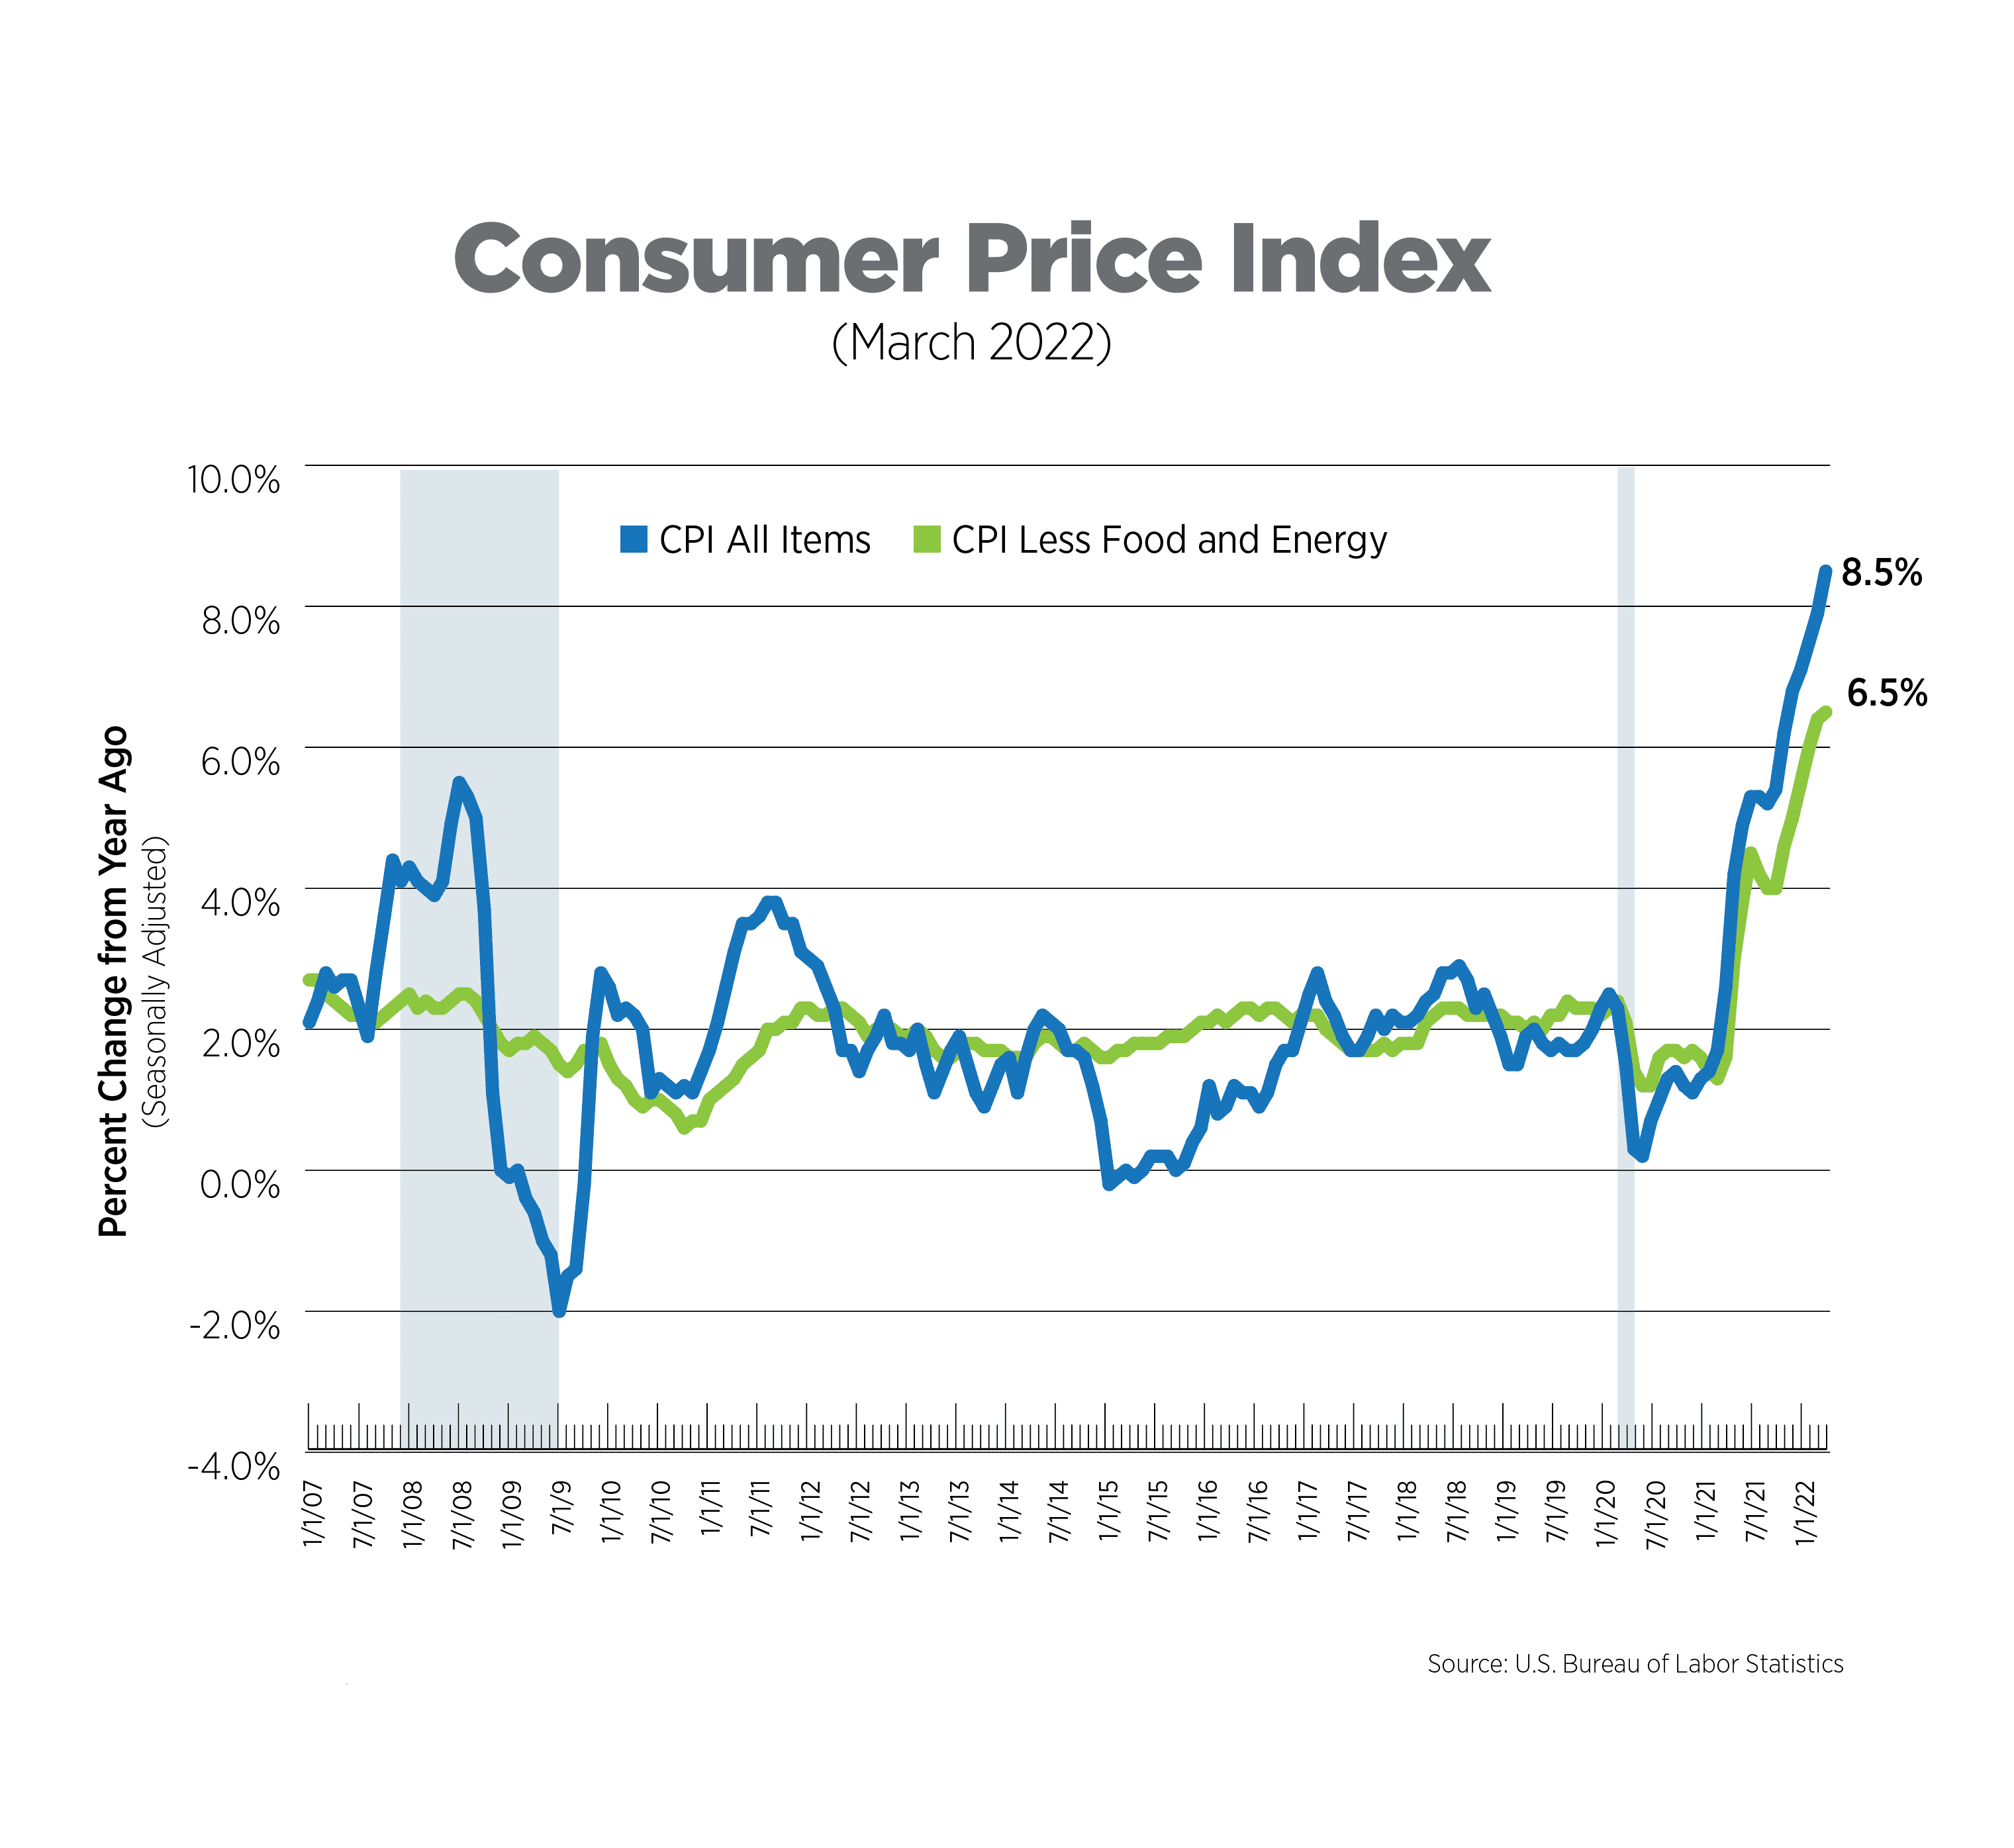
Once again, the Consumer Price Index (CPI) and core CPI (excluding food and energy) reached 40-year highs, increasing 8.5% and 6.5%, respectively, prior to seasonal adjustment. The headline number came in just a hair above analysts’ expectations of 8.4%. On a monthly basis, energy was up 11.0%, the highest increase since 2005, while airfares were not far behind at 10.7%. This was the highest increase for airfares on record since the data became available in 1989. Prices for used cars and trucks dropped by 3.8% after months of steep increases in 2020 and 2021. The core CPI moderated somewhat, to 0.3%, following 5 months of increases in the 0.5%-0.6% range.
Last week, several members of the Federal Reserve acknowledged that they need to move faster and bolder in battling inflation. Rate increases exceeding last month’s 25-basis point increase and a faster drawdown of their balance sheet can be expected in the coming months.
CPI for Housing, March 2022
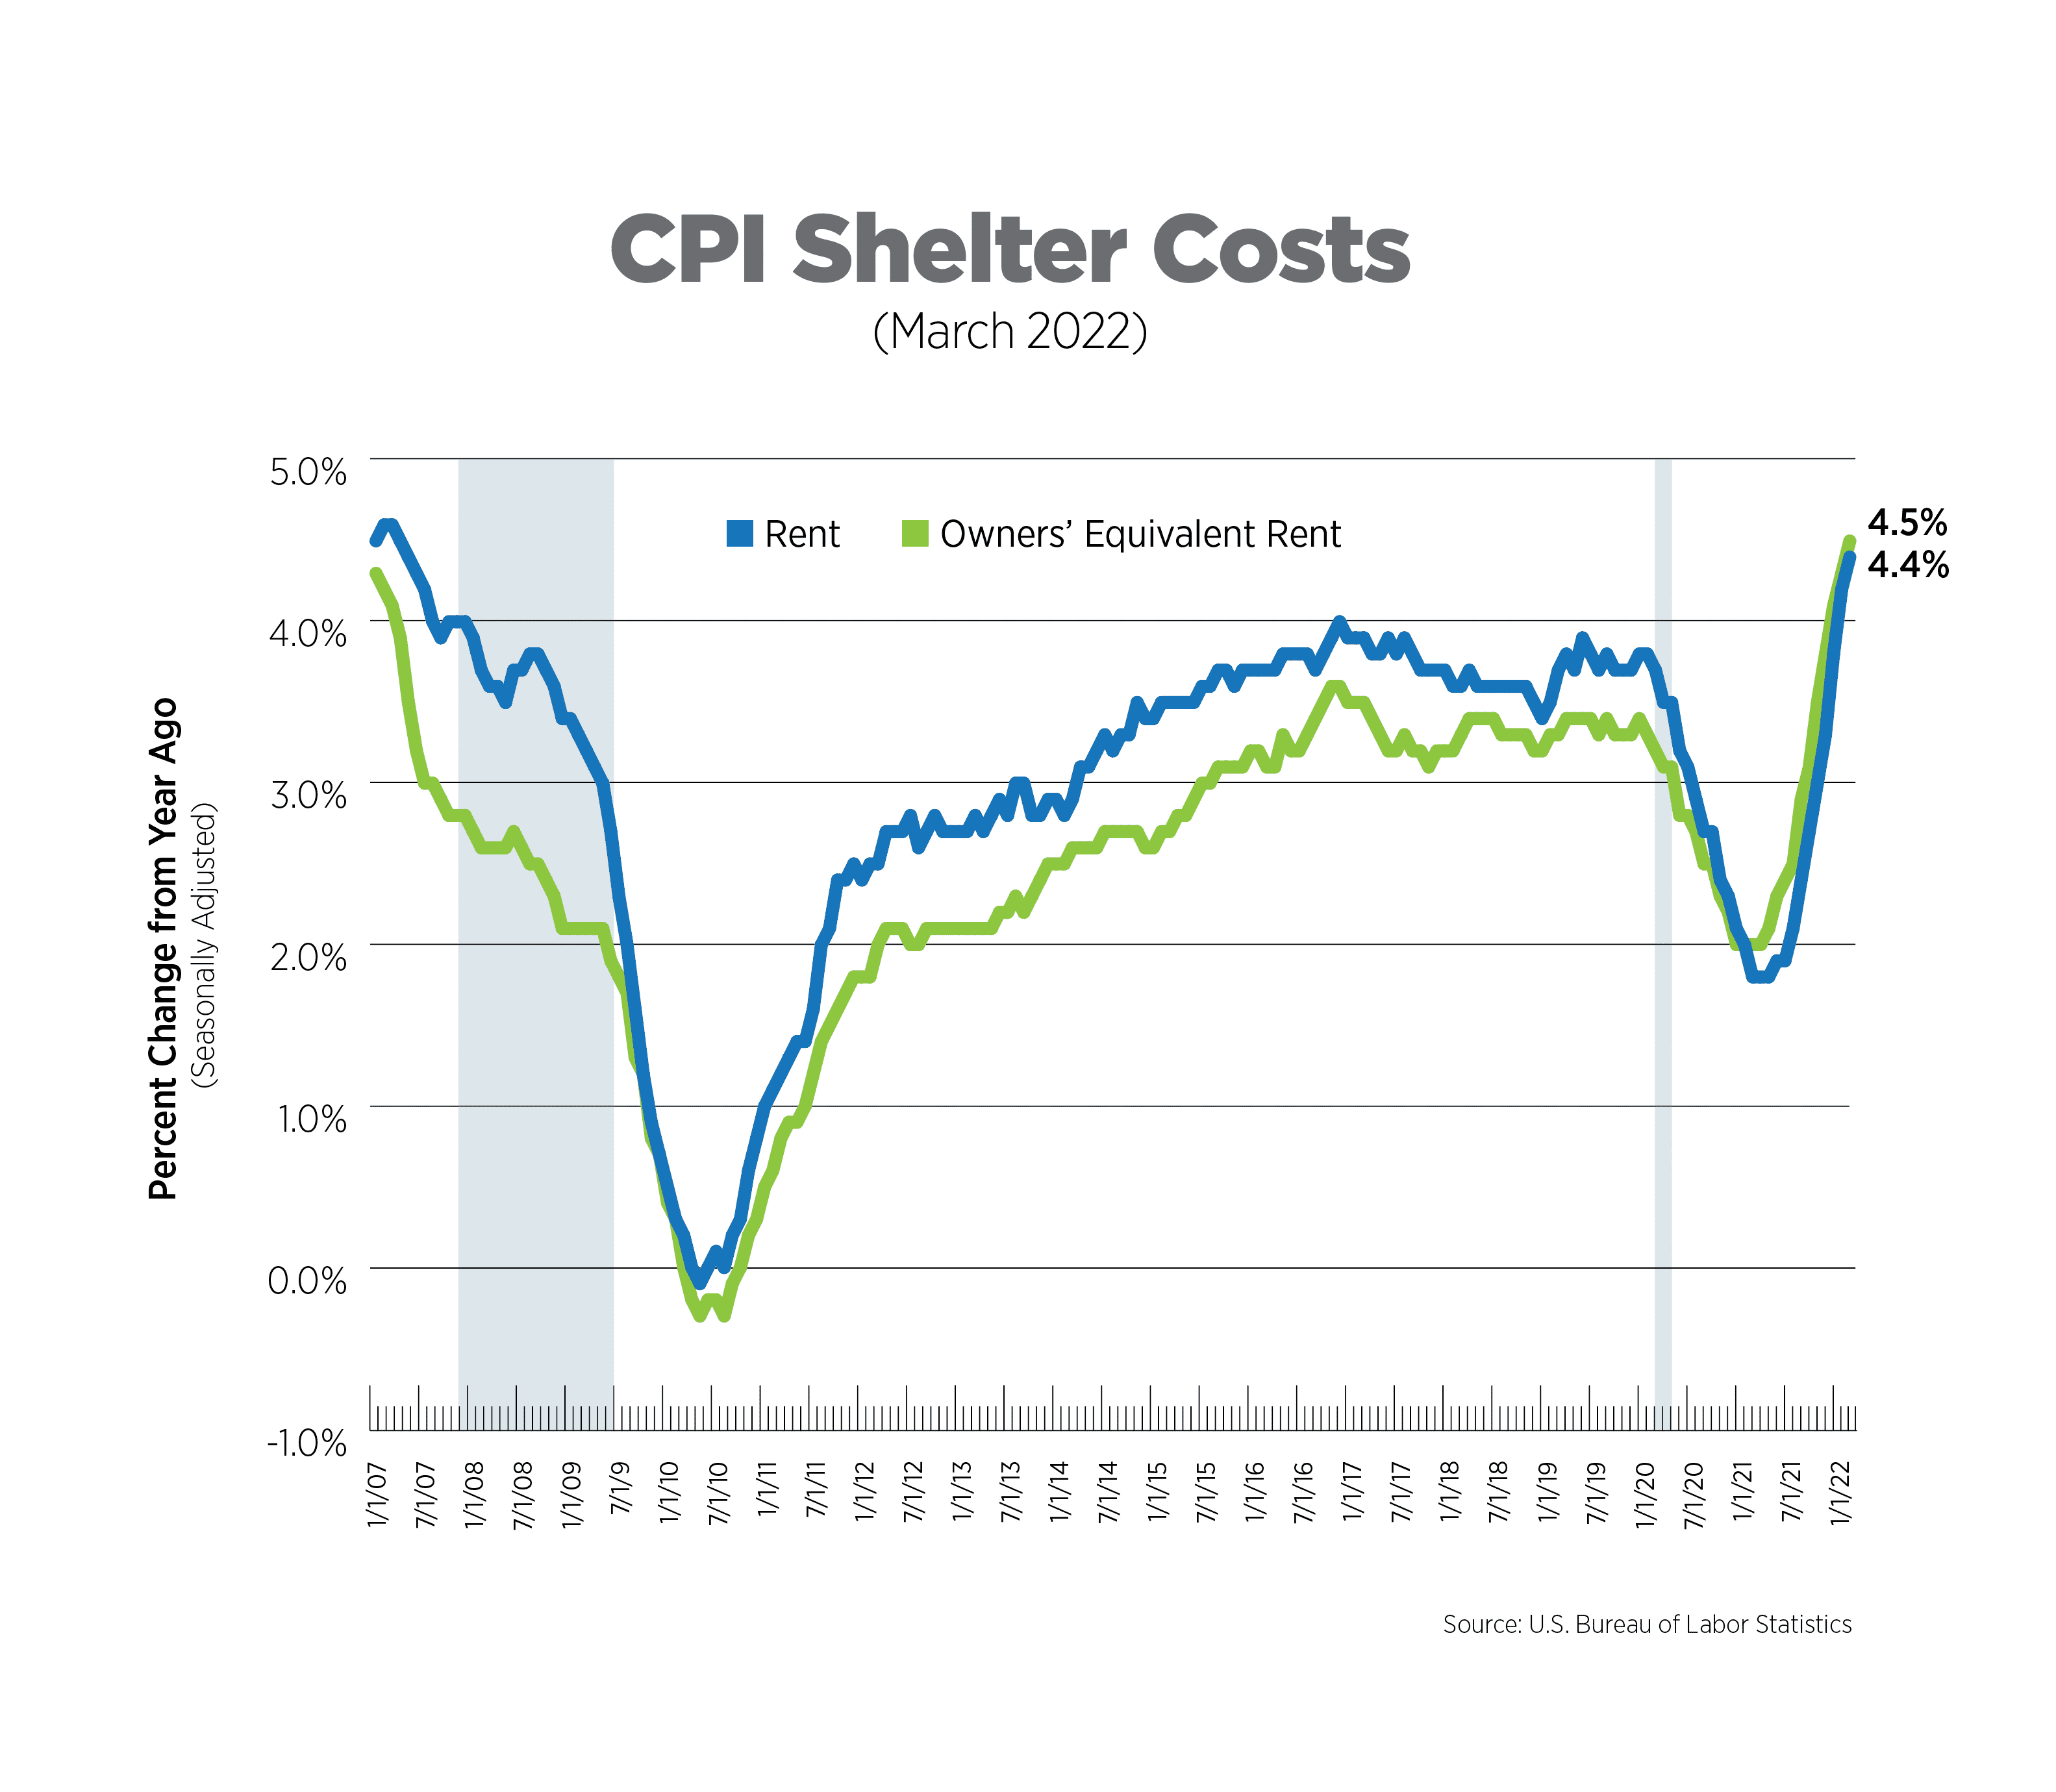
The CPI includes two measures for shelter costs: owners’ equivalent rent and rent of primary residence, both of which are self-reported. Together, they comprise about one-third of CPI. Owners’ equivalent rent, which is the price owner-occupiers think they could attain if they rented their homes, increased 4.5% while rent of primary residence was up 4.4% year-over-year, the highest increase since 2007. It’s important to note that both measures lag actual changes in housing costs as the data are collected less frequently than other components of the CPI. Therefore, we can expect to see further upward pressure on shelter costs.
There are signs that the housing market may have begun to cool with mortgage applications recently falling to their lowest level in 3 years, due in part to the 30-year fixed rate mortgage at its highest level since late 2018.
Alternative Measures of Inflation, February 2022
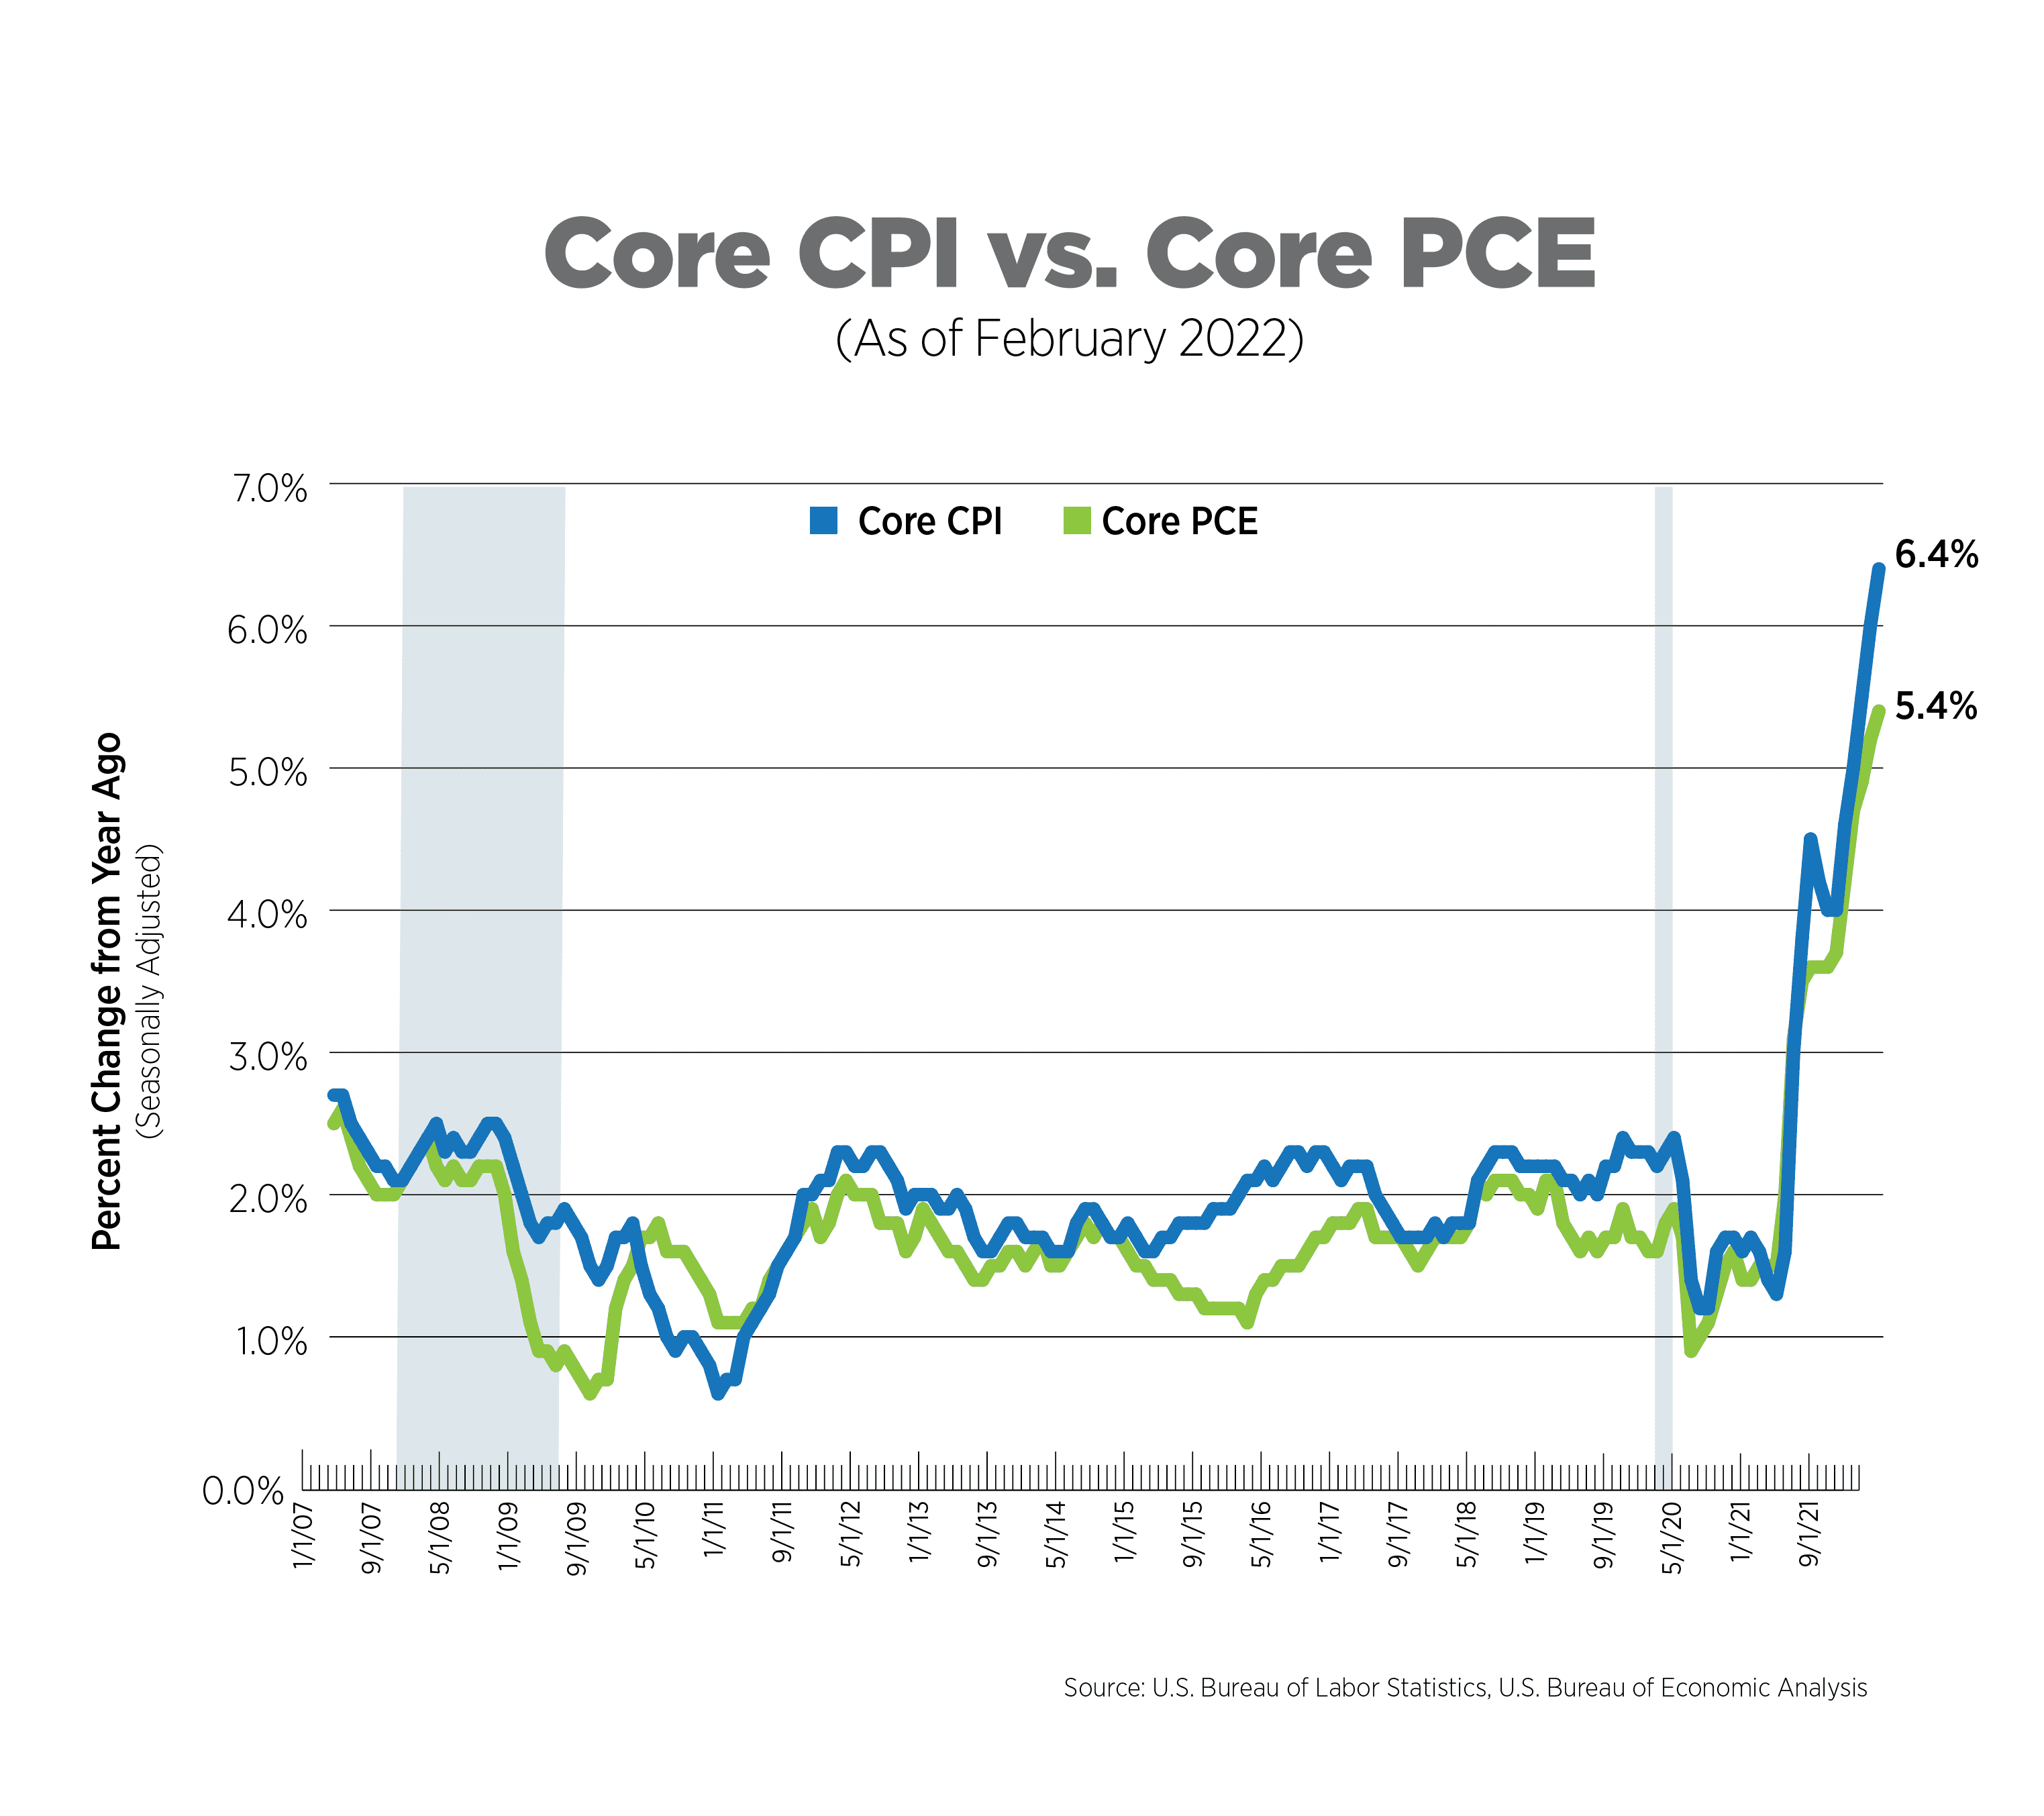
The core Personal Consumption Expenditures (PCE) Index is the measure of inflation the Federal Reserve Bank uses in its policy decisions. It is produced by the Bureau of Economic Analysis and uses different formulas, different weights and has a different scope compared to the Bureau of Labor Statistics’ (BLS) CPI.
Once again, headline and core PCE hit near 40-year highs, increasing 6.4% and 5.4%, respectively. On a monthly basis, core PCE moderated somewhat to a 0.4% increase, but after 0.5% increases for the prior 5 months, the slight dip is not enough to remotely impact the Fed’s stated policy of more aggressively tightening monetary policy.
Global Supply Chain Pressure Index, February 2022
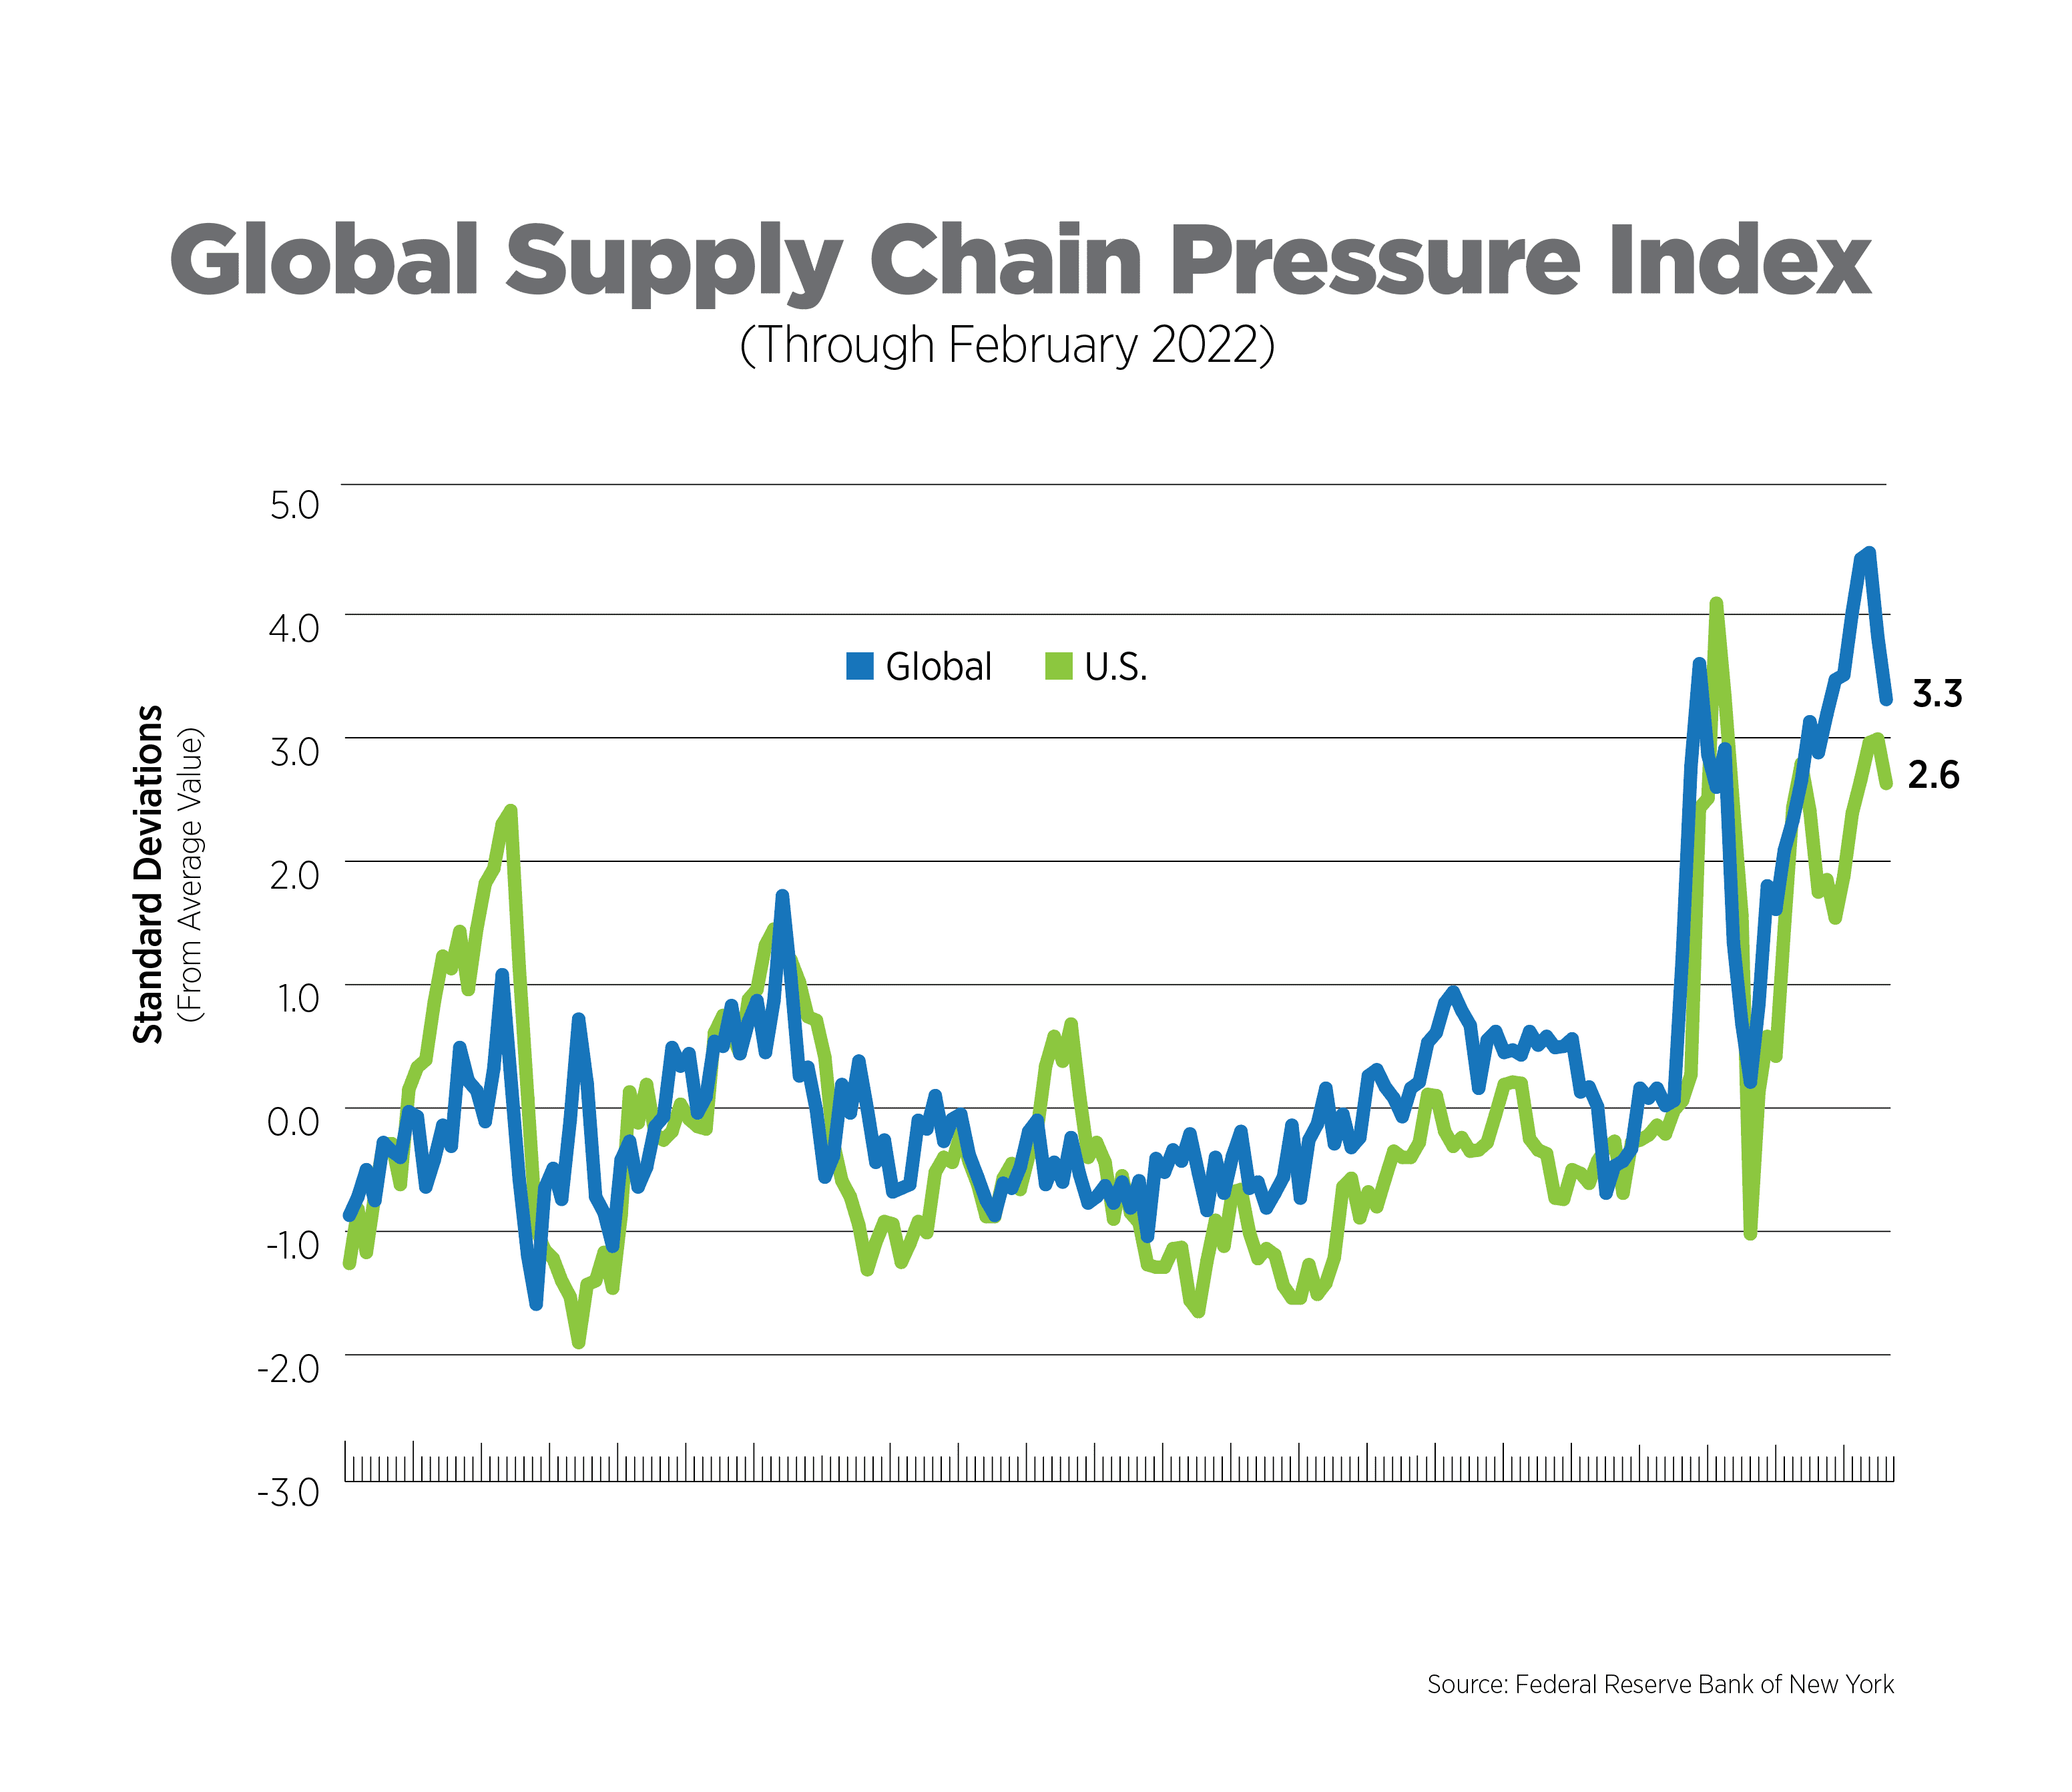
Supply chain pressures are just one cause of the current spike in inflation. The Federal Reserve Bank of New York created a new index to measure stress in the global supply chain, using 27 variables from different countries, including shipping rates and delivery times. A value of zero indicates average conditions in the supply chain.
The February release of the GSCPI brought with it new index measures by country. Pressures on the global supply chain declined for two consecutive months but remain elevated. The good news is the declines appear to be broad-based with pressures easing across geographies and indicators.
Country-specific data are more volatile due to fewer data inputs. Regardless, since the most recent update of the index is through February, meaning the impacts of Russia’s war on Ukraine and the Covid shutdowns in China are not accounted for, we can expect upward pressure on global supply chains in the coming months.
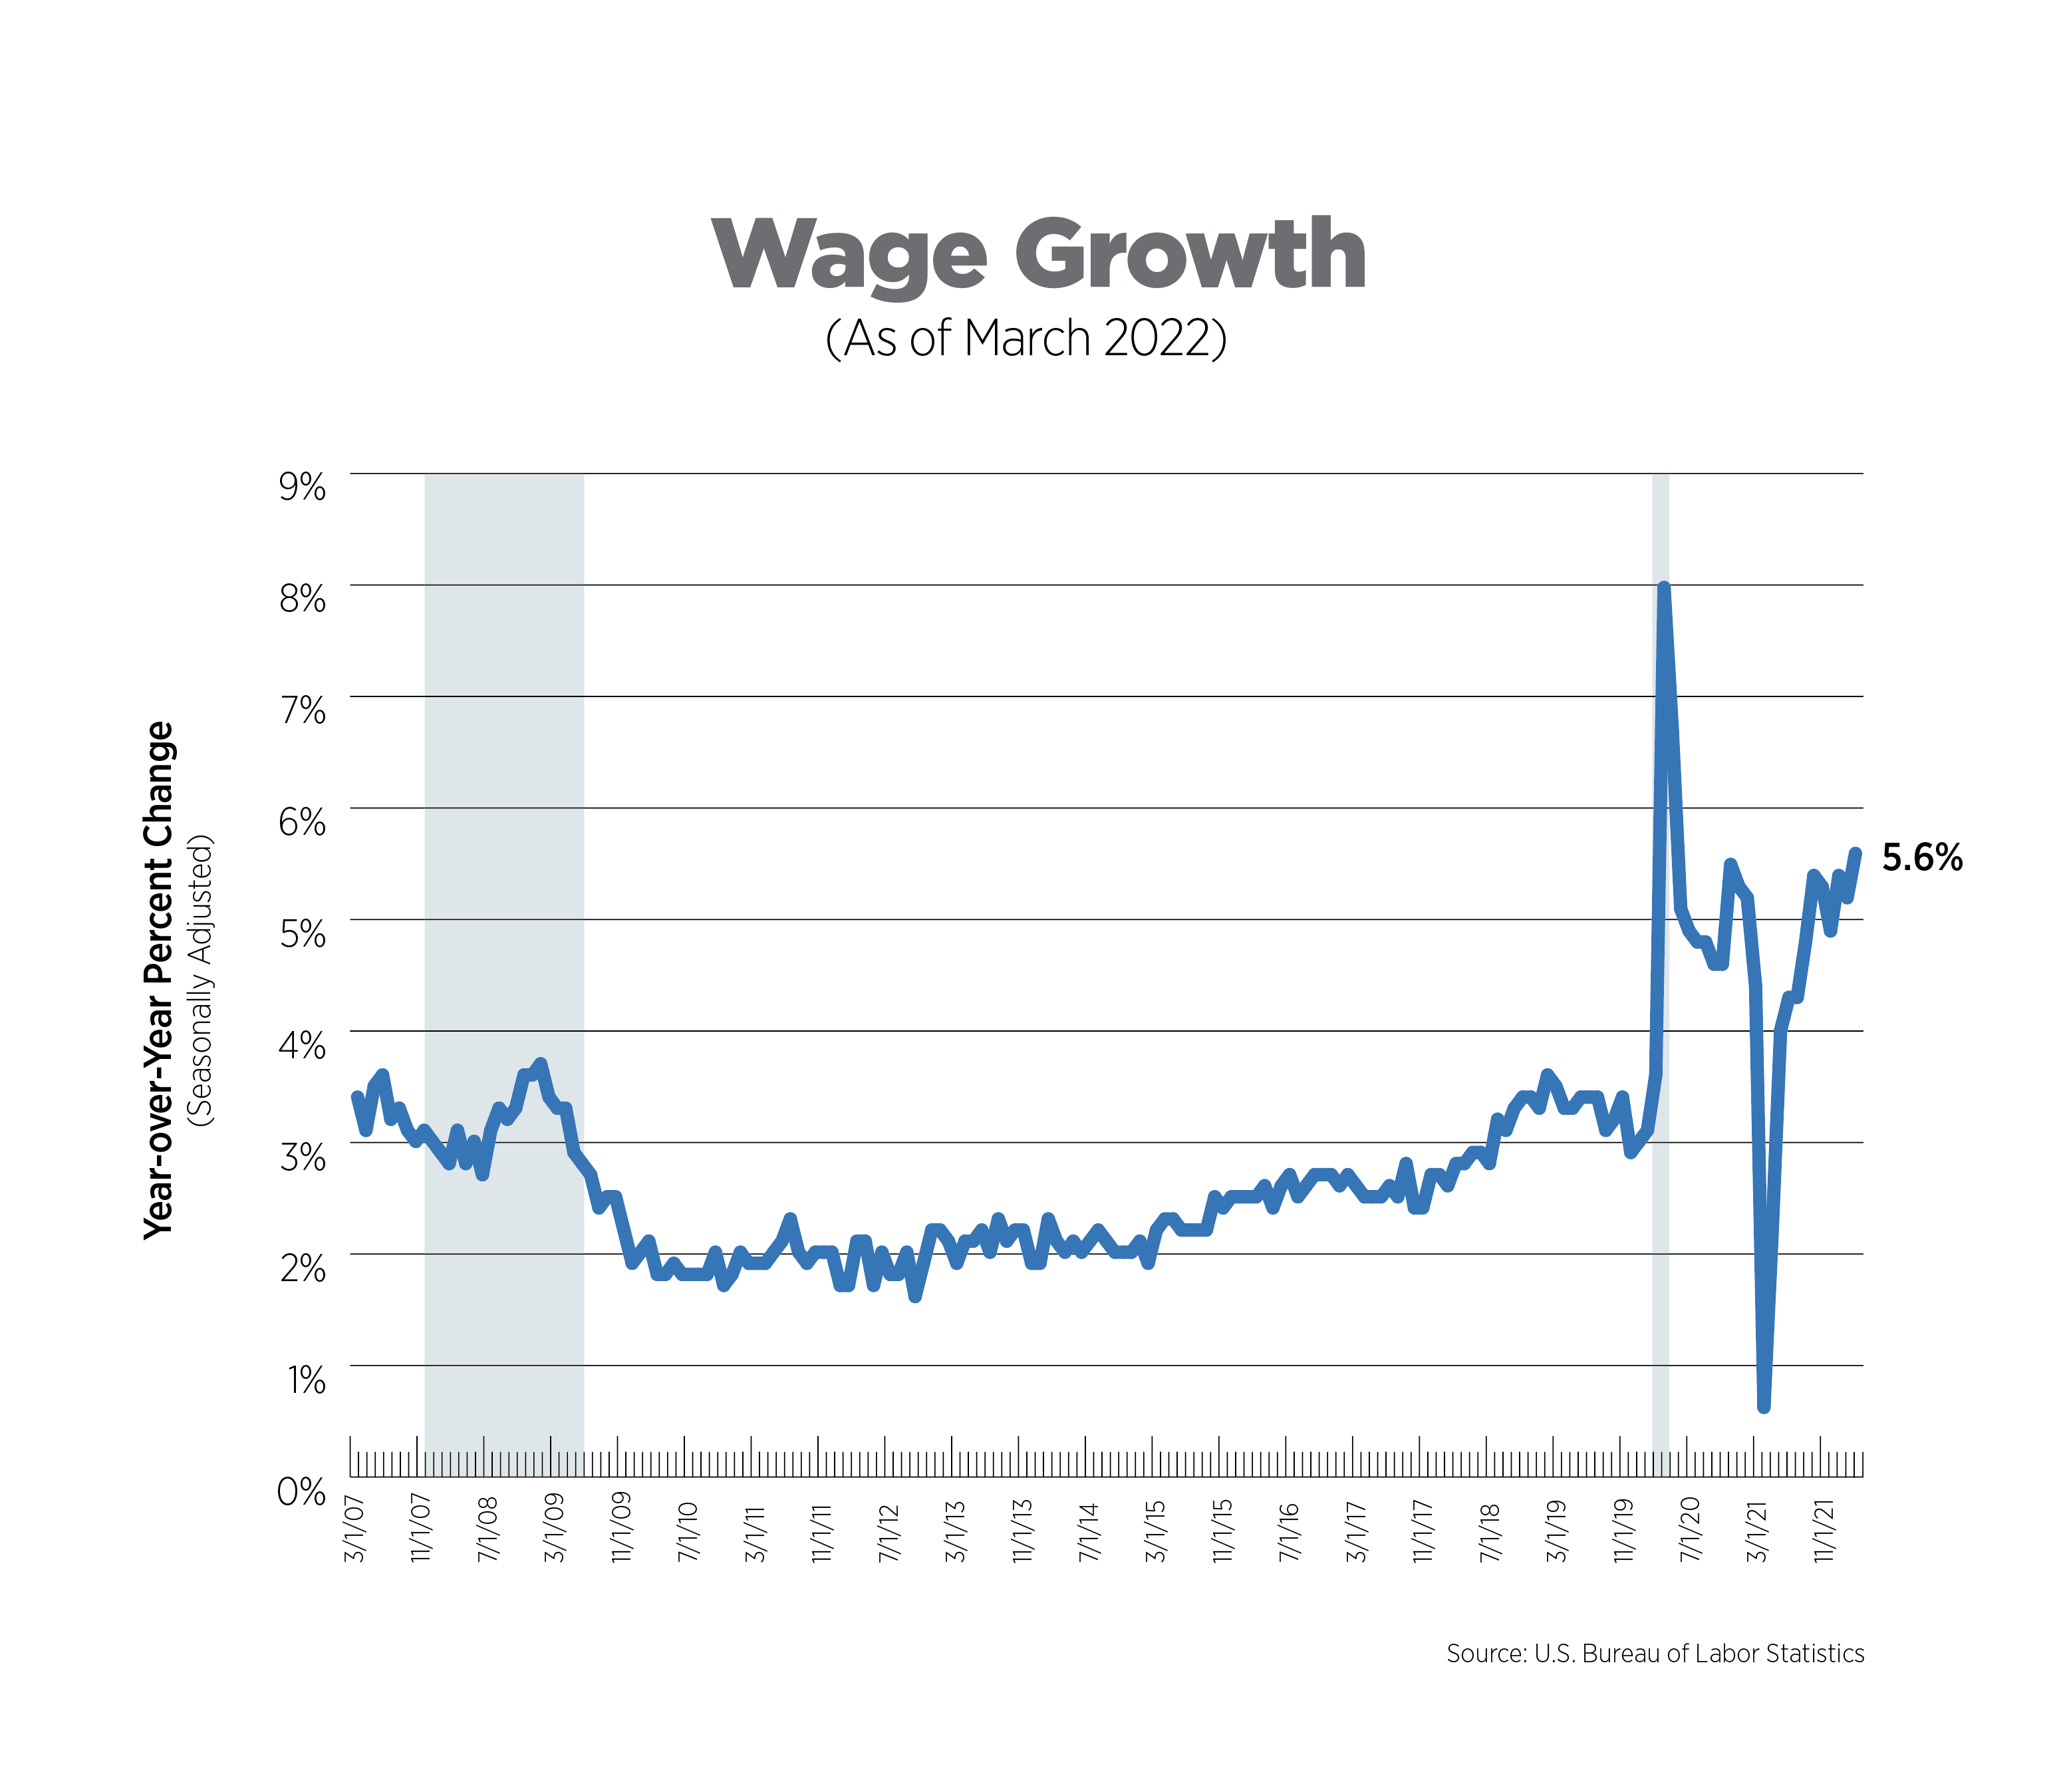
Wage Growth, March 2022
Wage growth, as measured by average hourly earnings, increased 5.6% over the year. Leisure/hospitality and transportation/warehousing were the only sectors that kept pace with inflation. Despite 8 consecutive months of double-digit increases, leisure/hospitality jobs remained the lowest-paying sector at $19.68 per hour. At this point, wages are not the main driver of overall price increases, but the risks of a wage-price spiral are real.
What to Watch in the Next Month
The Federal Open Market Committee convenes on May 3- 4 and has already indicated that bolder actions would be coming out of this meeting. It is widely anticipated that the Fed will increase rates by 0.5%, and potentially higher in subsequent months, while feverishly reducing its balance sheet.
Next Tracker: May 11, 2022