NAA Inflation Tracker
CPI, Latest Release, June 2021 5.3%
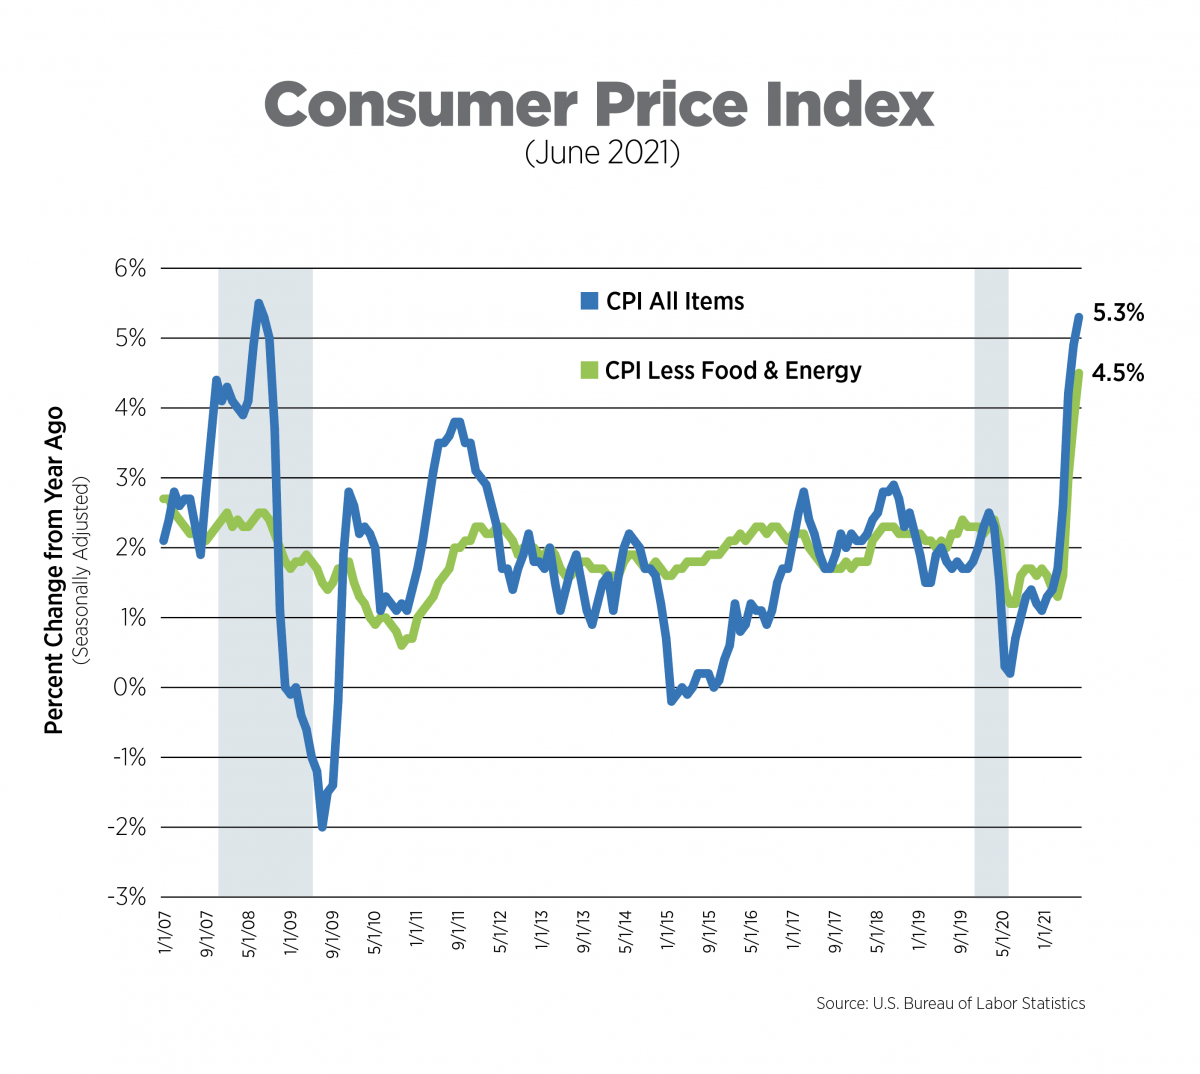
The Consumer Price Index (CPI) rose by 5.3% on a year-over-year basis while prices excluding food and energy (core CPI) rose 4.5%. CPI hit higher levels during the Great Recession, but we have to go back to the 1990/1991 recession to see a level of growth this high for core CPI.
The Federal Reserve is standing by its position that inflation will be transitory and when breaking it down by category, it’s easy to see why. Prices for used cars and trucks were responsible for more than one-third of the all-items increase, up 62% year-over-year. Prices also increased substantially for new vehicles, airline fares and apparel. These are all tied to the reopening of the economy, which while occurring in phases, is a one-time event, a fact which should help alleviate fears of long-lasting inflation.
Alternative Measures of Inflation, June 2021
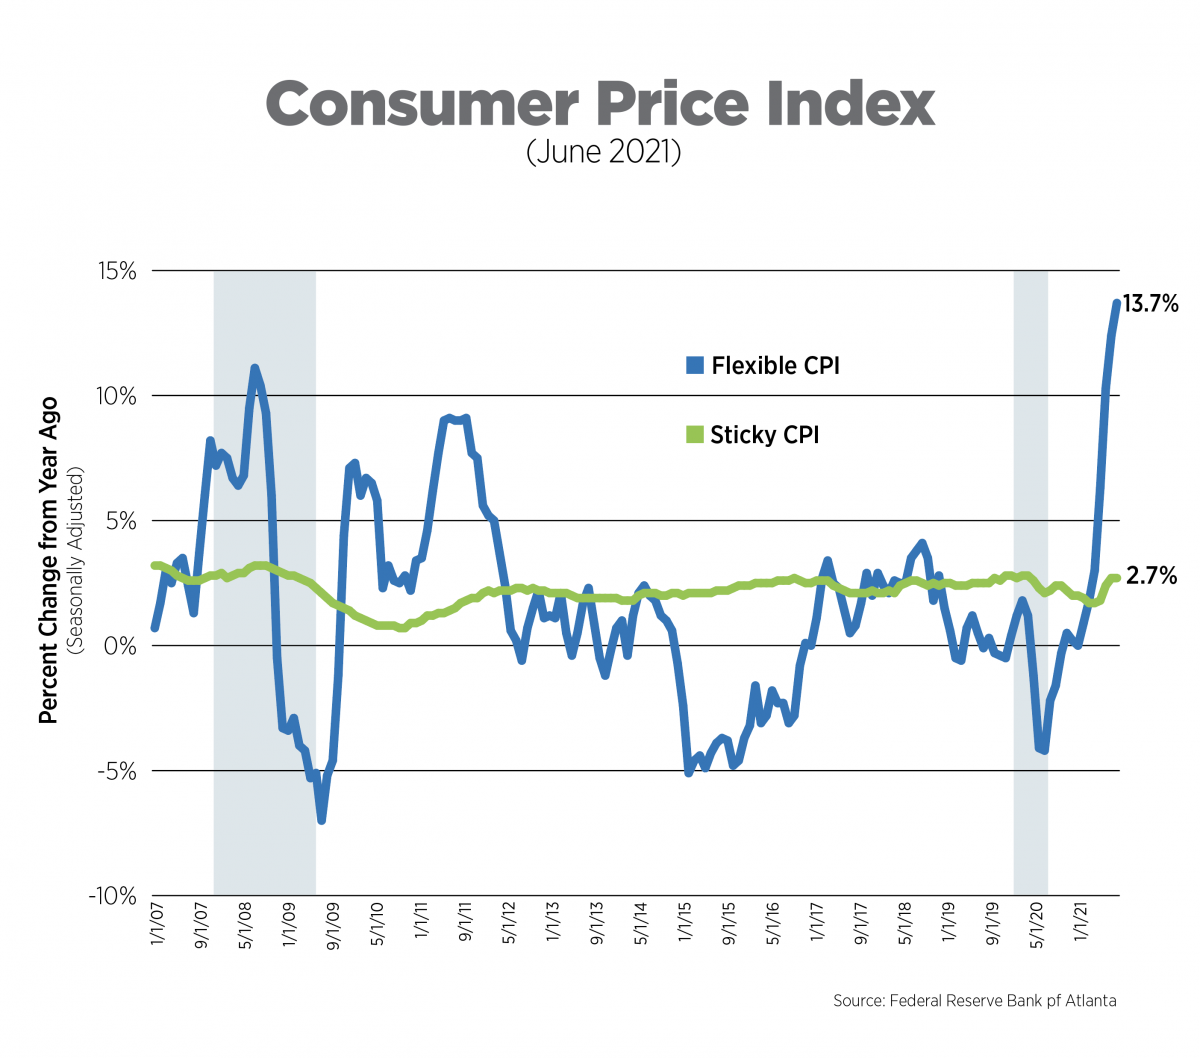
The Federal Reserve Bank (FRB) of Atlanta uses measures of inflation it refers to as “Flexible CPI” and “Sticky CPI,” basically categorizing CPI components by price volatility. Goods and services with sticky prices, considered a more forward-looking approach and estimated to comprise 70% of headline CPI, do not typically respond to changing market dynamics quickly – think rent, education and public transportation. Flexible prices change far more frequently and often wildly – think gas, food and hotels.
In June, flexible price CPI increased 13.7% on a year-over-year basis while sticky price CPI increases remained unchanged from the prior month at 2.7%, in line with the 2019 monthly average of 2.6%.
Alternative Measures of Inflation, May 2021
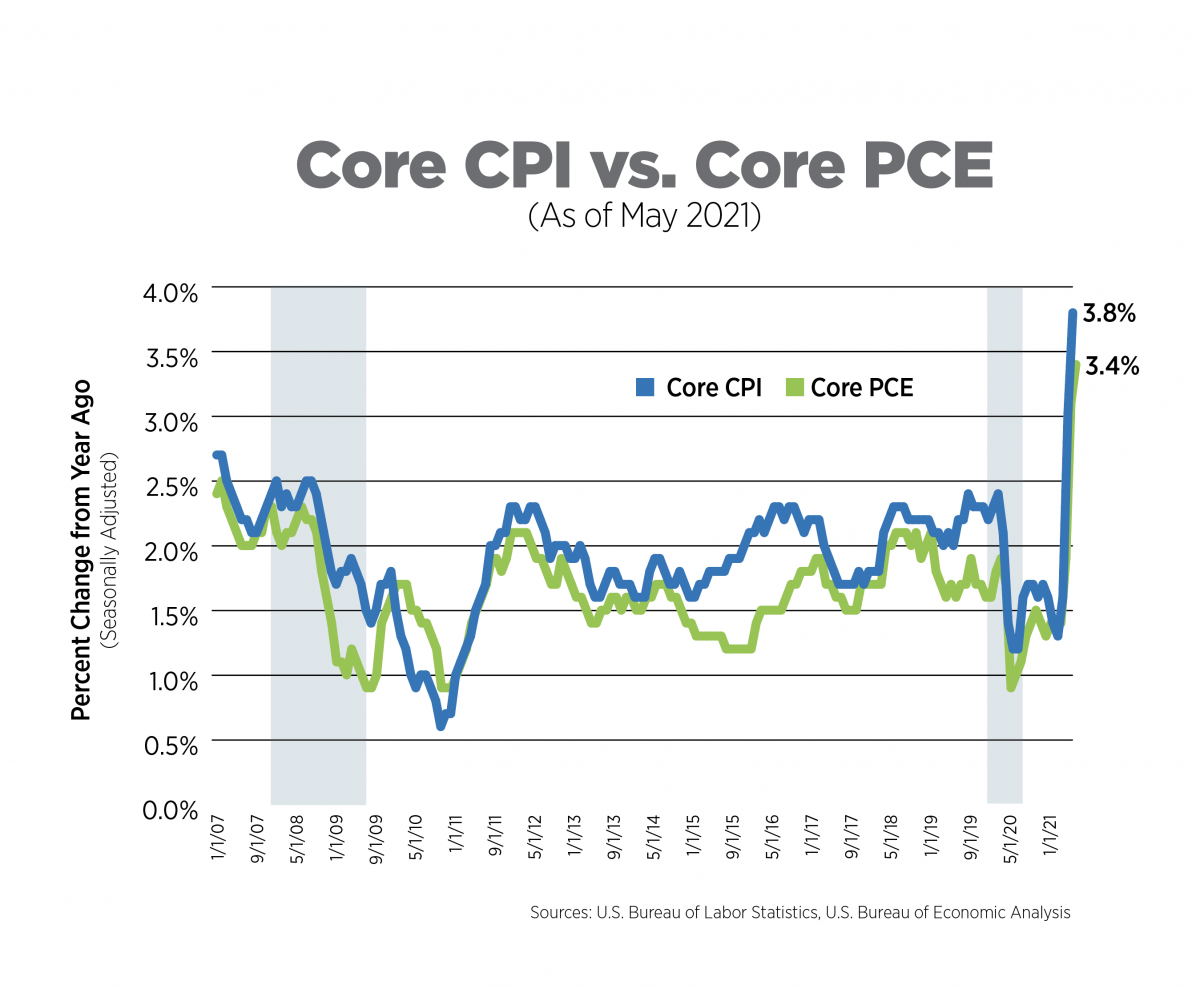
The Personal Consumption Expenditures (PCE) Index is the measure of inflation the Federal Reserve Bank uses in its policy decisions. It is produced by the Bureau of Economic Analysis and uses different formulas, different weights and has a different scope compared to the Bureau of Labor Statistics’ (BLS) CPI.
In May (the most recent data available) the core PCE rose 3.4% year-over-year, the highest increase in nearly 30 years, but tempered somewhat from the prior month’s growth. At its current rate of 3.4%, it would take 8 months for the PCE to achieve a five-year average of 2%, the Fed’s long-term target.
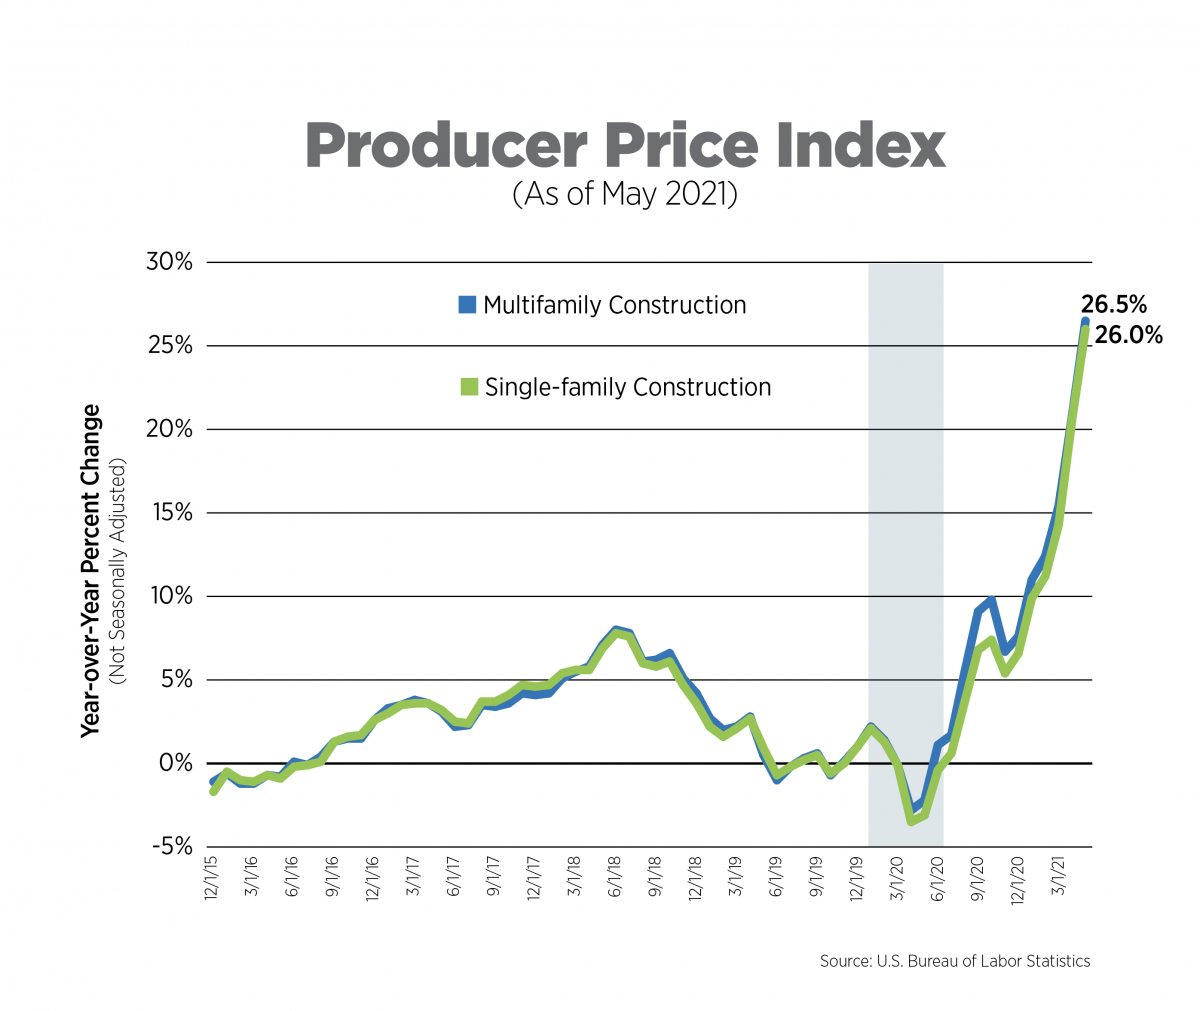
The Producer Price Index (PPI), May 2021
The BLS aggregates all construction inputs excluding capital investment, labor and imports for single-family and multifamily construction. Price increases for multifamily construction inputs have exceeded 10% for the past five months and soared to 26.5% in May on a year-over-year basis.
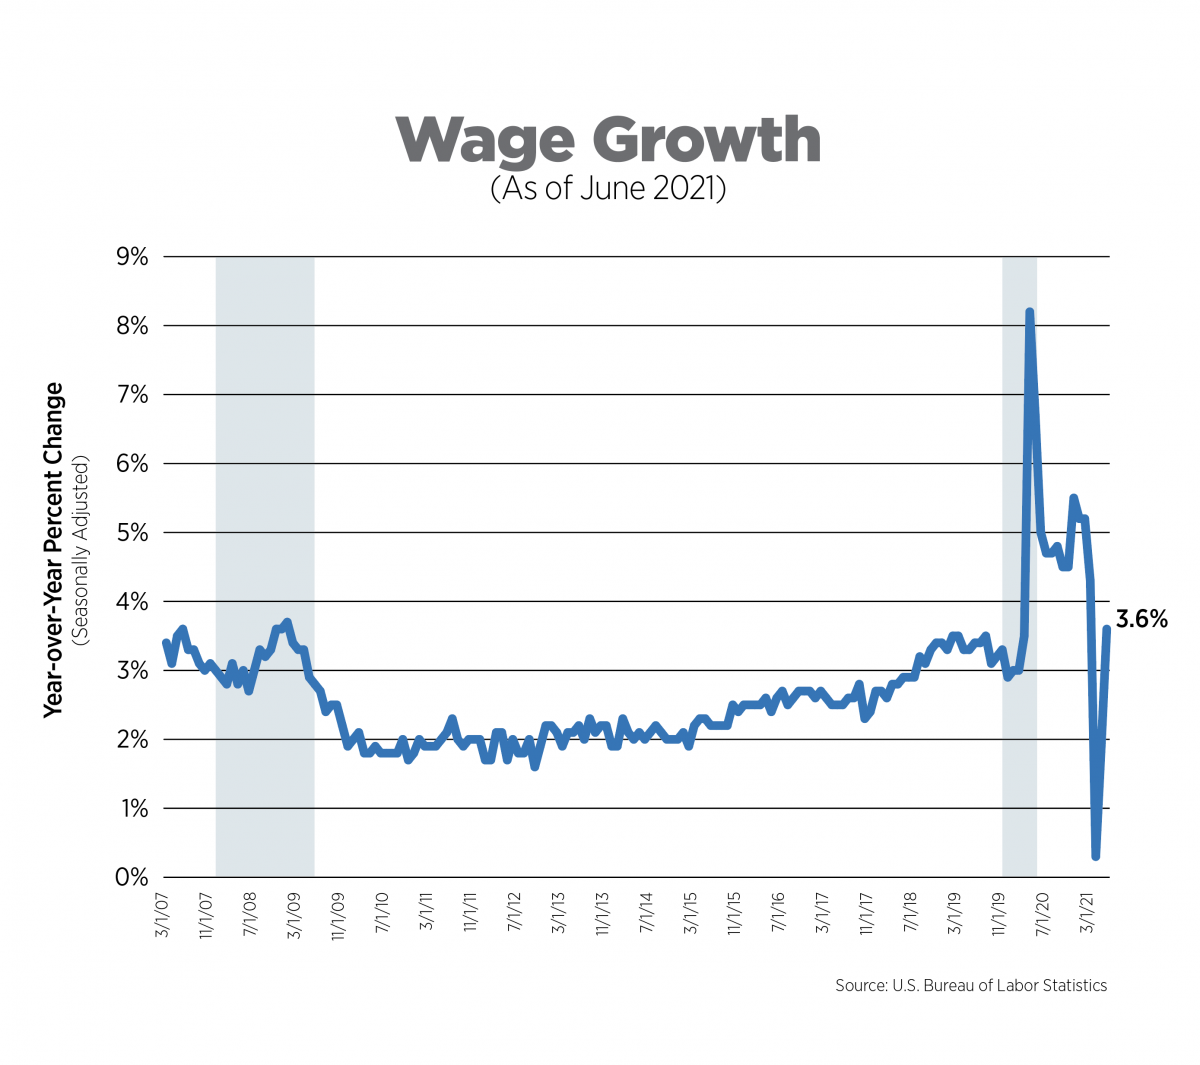
Wage Growth, June 2021
Private sector wage growth rose to 3.6% in June, in line with pre-pandemic levels. Breaking it down by sector reveals 7.1% growth in leisure and hospitality and 6.2% growth in retail trade. Wage growth is reflective of not only pay increases, but also signing bonuses as employers struggling to find workers provide extra incentives in order to stay competitive. It is important to note that real average hourly earnings (earnings adjusted for inflation) for all employees decreased 0.5% from May to June.
What to Watch in the Next Month
- Jerome Powell’s Semiannual Monetary Policy Report to Congress takes place on Wednesday, July 14 and inflation is sure to be the focal point of the Fed chairman’s testimony.
- The recent decline in lumber prices should be evident in next month’s PPI data, so look for increases to multifamily construction inputs to ease somewhat.
- The Employment Cost Index (ECI), a quarterly wage growth measure considered to be superior to average hourly earnings by some analysts and economists, will be released on July 30. The ECI is closely watched by the Fed.
Next Tracker: August 11, 2021