
Closing Out an Extraordinary Year for Apartments
U.S. Apartment Market
The apartment sector concluded a historical year with a final strong quarterly performance. Although the omicron variant has caused a surge in COVID-19 cases and disrupted the economy, apartment fundamentals persevered.
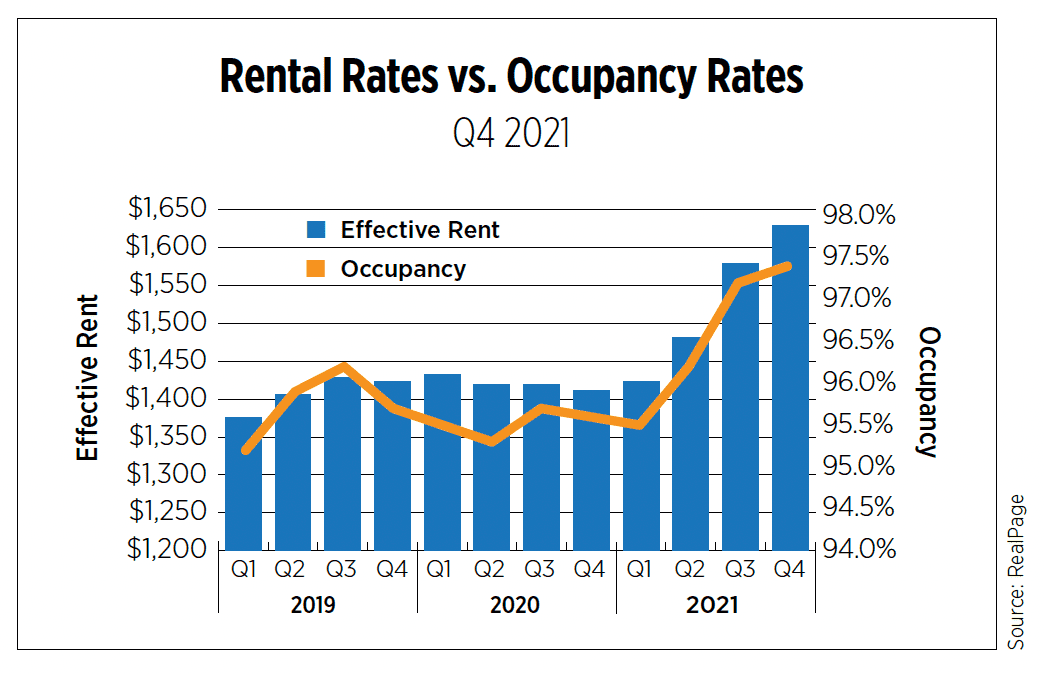
Robust apartment demand bolstered U.S rent growth once again during the fourth quarter. According to RealPage, effective rent soared to $1,629, dramatically increasing 15.5% since Q4 2020. All 79 markets tracked by REIS recorded positive year-over-year rent growth. Job growth and lower cost of living particularly drove rent prices in Sun Belt markets where renter in-migration has skyrocketed since the beginning of the pandemic. Florida markets including Jacksonville, Tampa and Palm Beach led the U.S in rent growth, posting nearly a 30.0% increase from a year earlier. Whereas, Lexington, Ky., Minneapolis and San Jose, Calif., were the markets to see rent growth below 5.0%
Even amid severe infections caused by the omicron variant and the off-season for apartment leasing, demand reached the highest levels in 30 years. According to RealPage, annual absorption reached a staggering 673,478 units. Net move-ins significantly surpassed annual new supply, which totaled 358,734 units.
Historical demand in conjunction with limited apartment availability triggered occupancy rates to also reach historically high levels. As reported by RealPage, U.S. occupancy inched up 0.2 percentage points from the previous quarter to 97.4%, marking the first time occupancy has increased during the fourth quarter. According to REIS, Raleigh-Durham, N.C.; Louisville, Ky.; Charleston, S.C.; San Antonio and Washington, D.C. were among the strongest markets for occupancy growth year-over-year. Meanwhile, Lexington, Ky.; Tacoma, Wash.; Palm Beach, Fla.; Kansas City, Mo., and Minneapolis saw the highest increases in vacancy.
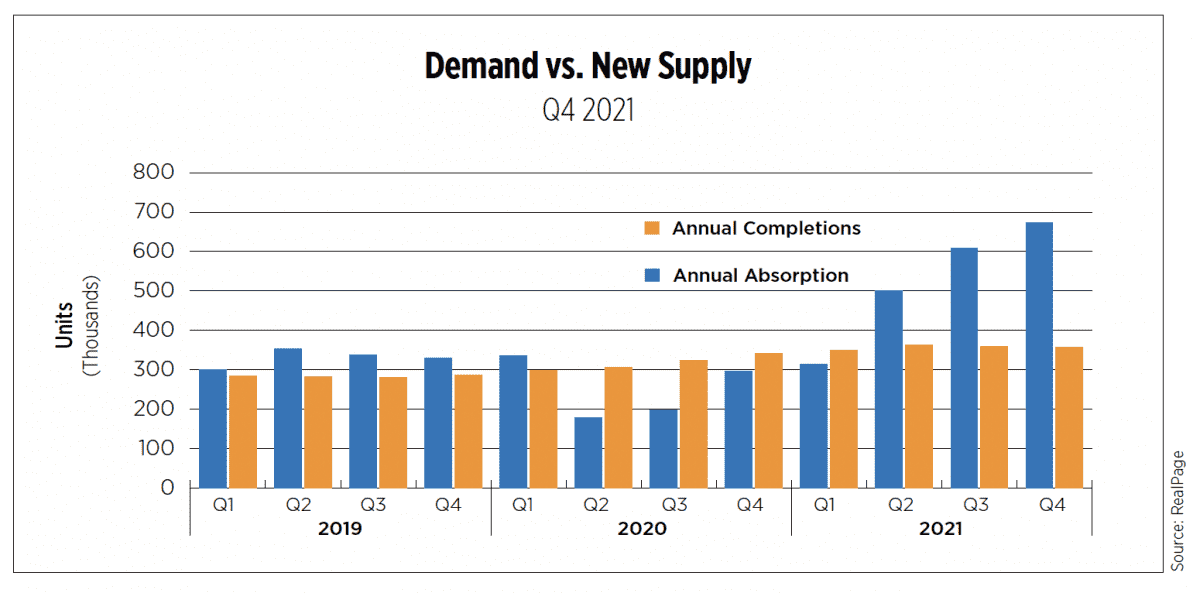
According to the Census Bureau, the seasonally adjusted annual rate for multifamily construction starts in December 2021 totaled 524,000 units, a sizeable increase of 56.0% since the same time in 2020. However, completed units continued to trend downward as supply-chain disruptions and labor shortages lingered into Q4. Multifamily completions declined by 28.0% to 299,000 units. Multifamily building permits increased by 41.8% to 675,000 units. The leading markets for permits issued in 2021 through November 2021 included New York City (37,165 units); Dallas (24,473 units) and Austin, Texas (23,036 units); Seattle (18,263 units) and Los Angeles (16,508 units).
U.S. Capital Markets
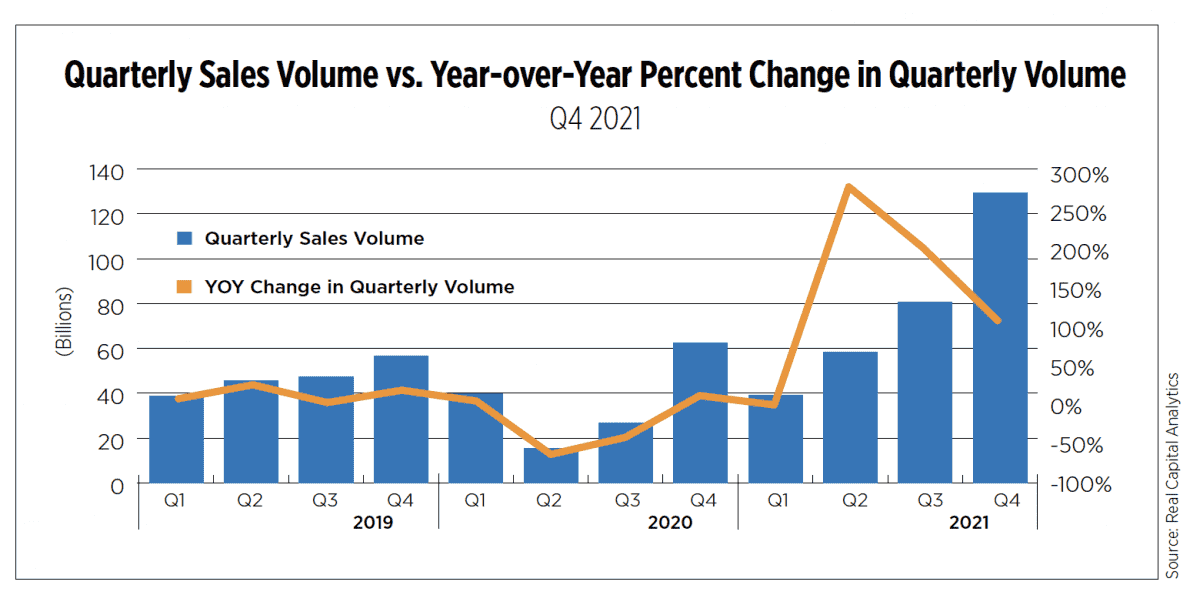
With apartment demand, rent growth and occupancy surging, investment activity remained solid during the final quarter as capital has poured into the multifamily sector. According to Real Capital Analytics, 638,723 units sold during the quarter for $129.3 billion, increasing 70.4% since Q4 2020. The average price per unit increased to 29.2% to $238,266. Cap rates averaged 4.5%, down 63 basis points. Dallas ($21.9B); Los Angeles ($18.5B), Atlanta ($18.3B), Phoenix ($16.4B) and Houston ($15.3B) ranked as top markets by sales volume in 2021, as investors have generally shifted capital away from core coastal markets and into the Sun Belt. In 2021, garden-style asset sales totaled $202.8 billion, while mid-/high-rise properties totaled $104.8 billion. Since 2020, the composition of buyers saw the highest growth among REIT investors. In contrast, deals conducted by private buyers declined 2.4% from last year.
U.S. Economy
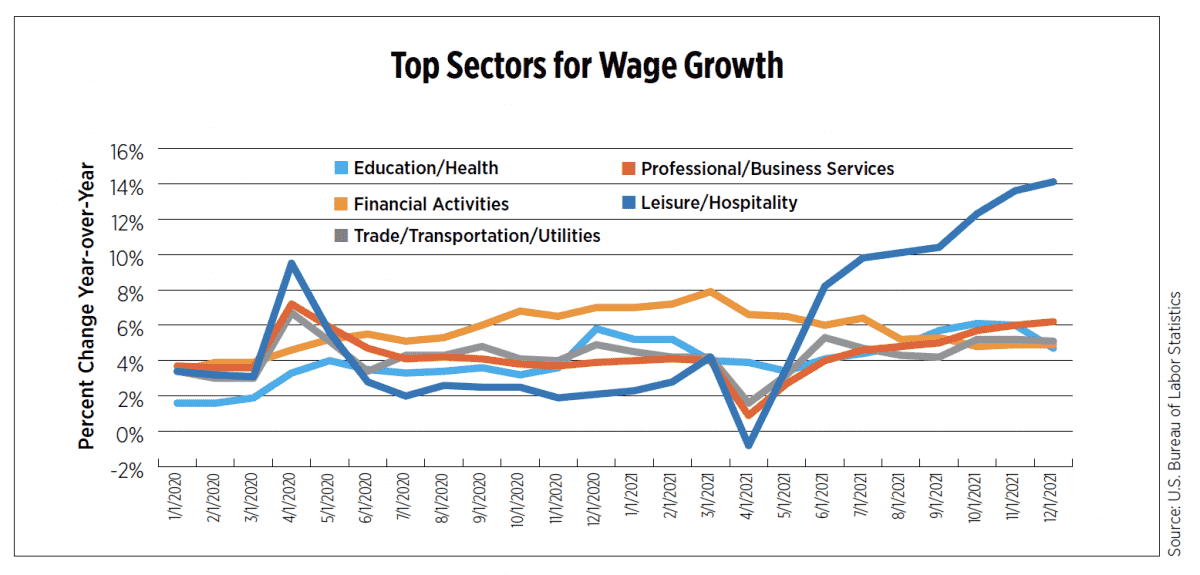
The labor market tightened further in the fourth quarter as the unemployment rate progressed toward pre-pandemic levels to 3.9%. While some of that improvement represents workers detached from the job market, the labor force participation rate continued to inch up, closing in on 62% by the end of the year but with plenty of room for improvement. Job openings and quits remained near record highs, driving wages up across all sectors.
Initial indications of omicron’s impact on the labor market are beginning to reveal themselves ahead of the January Employment Situation Report, to be released Feb. 4. Initial claims for unemployment are on the rise. After hitting a recovery low of 188,000 new claims for the week ending Dec. 4, and essentially leveling off in December around 200,000 per week, seasonally adjusted claims rose precipitously in January with nearly 100,000 more new claims by the week ending Jan. 15.
Additionally, the most recent Census Household Pulse Survey, covering the period from Dec. 29 – Jan. 10, showed 6.5 million more people were out of work compared to the prior survey (Dec. 1-13). While some of that difference can be attributed to seasonal factors as employers ramped up before the holidays, the pandemic effects are palpable in the responses to the question that ask the reason for not working. Compared to the prior survey, 5.8 million more workers said they were not working because they were either caring for someone who was sick or were sick themselves with coronavirus symptoms.
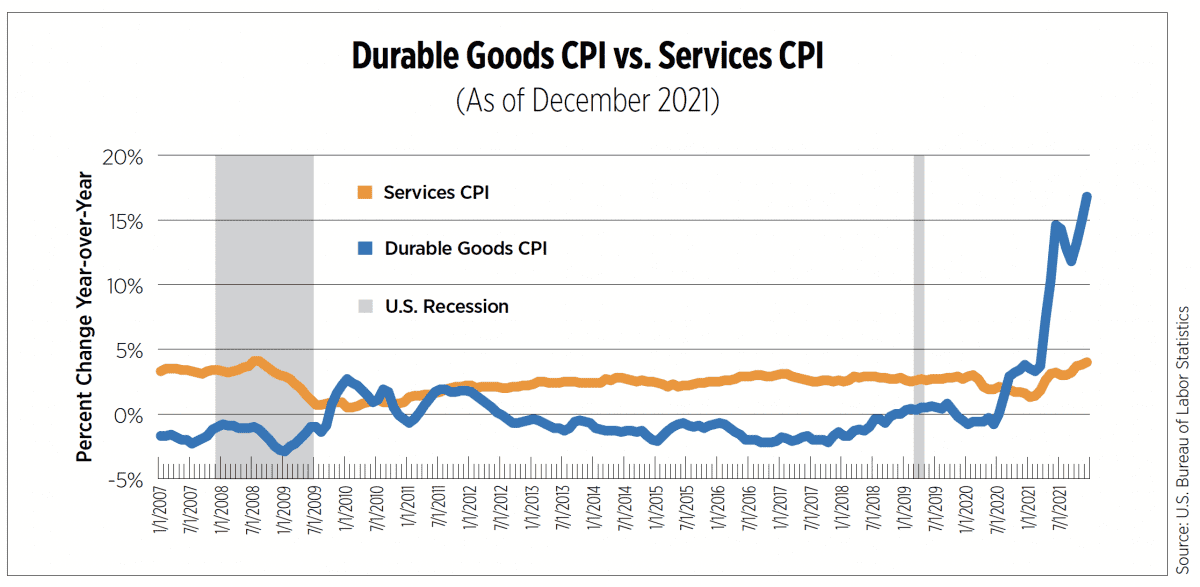
Inflation ran high throughout the quarter with the final reading of 2021 measuring 7.1% year-over-year, the highest level in nearly 40 years. Despite price increases being broad-based, the highest increases were closely tied to the pandemic phenomena of unleashed pent-up consumer demand and supply chain disruptions. The supply chain has been impacted by several factors including factory shutdowns causing low levels of inventory and elevated demand exacerbating those shortages. The well-documented semiconductor chip shortage reaches well beyond vehicles as an increasing number of products become digitized. These impacts become evident when breaking down inflation by goods versus services. The Consumer Price Index (CPI) for durable goods, those with an average useful life of at least three years, increased 16.8% year-over-year in December, the highest measure since the data series began in the late 1950s. Prices for services, while elevated, increased 4.0%, in line with trends seen in the 1990s and 2000s.
Outlook
Based on data released by both South Africa and the United Kingdom, where omicron infections were detected before the U.S., it is possible the omicron wave will peak in the coming weeks. There is already evidence in the Northeast, where infections were first reported, that cases are on the decline. If no new variants arise, omicron might prove to be a hiccup in an otherwise strong recovery. While supply chain disruptions, expected to begin to ease during the second half of this year, will moderate inflation, there are no fast fixes for the labor market. Structural changes stemming from the pandemic, demographics and behavioral shifts will keep labor market challenges front and center for the next several years. The Fed will raise interest rates this year and by some estimates, it could be as many as four times; overall, rates will remain low by historical standards.
Will 2022 be another stellar year for professionally managed apartments? According to RCLCO’s year-end 2021 Real Estate Market Sentiment Index, nearly half of commercial real estate industry leaders responding to the survey expect apartment rent levels to stay above historical levels in 2022, experiencing 5.0%-8.0% growth. Another 28.0%, however, expect rent growth to moderate to historical levels (2.0%-5.0% growth). Regardless, 2022 holds much promise for the industry mainly due to strong job growth, income growth, a continuation of robust household formation and investors who prize multifamily properties above most other asset types.